|
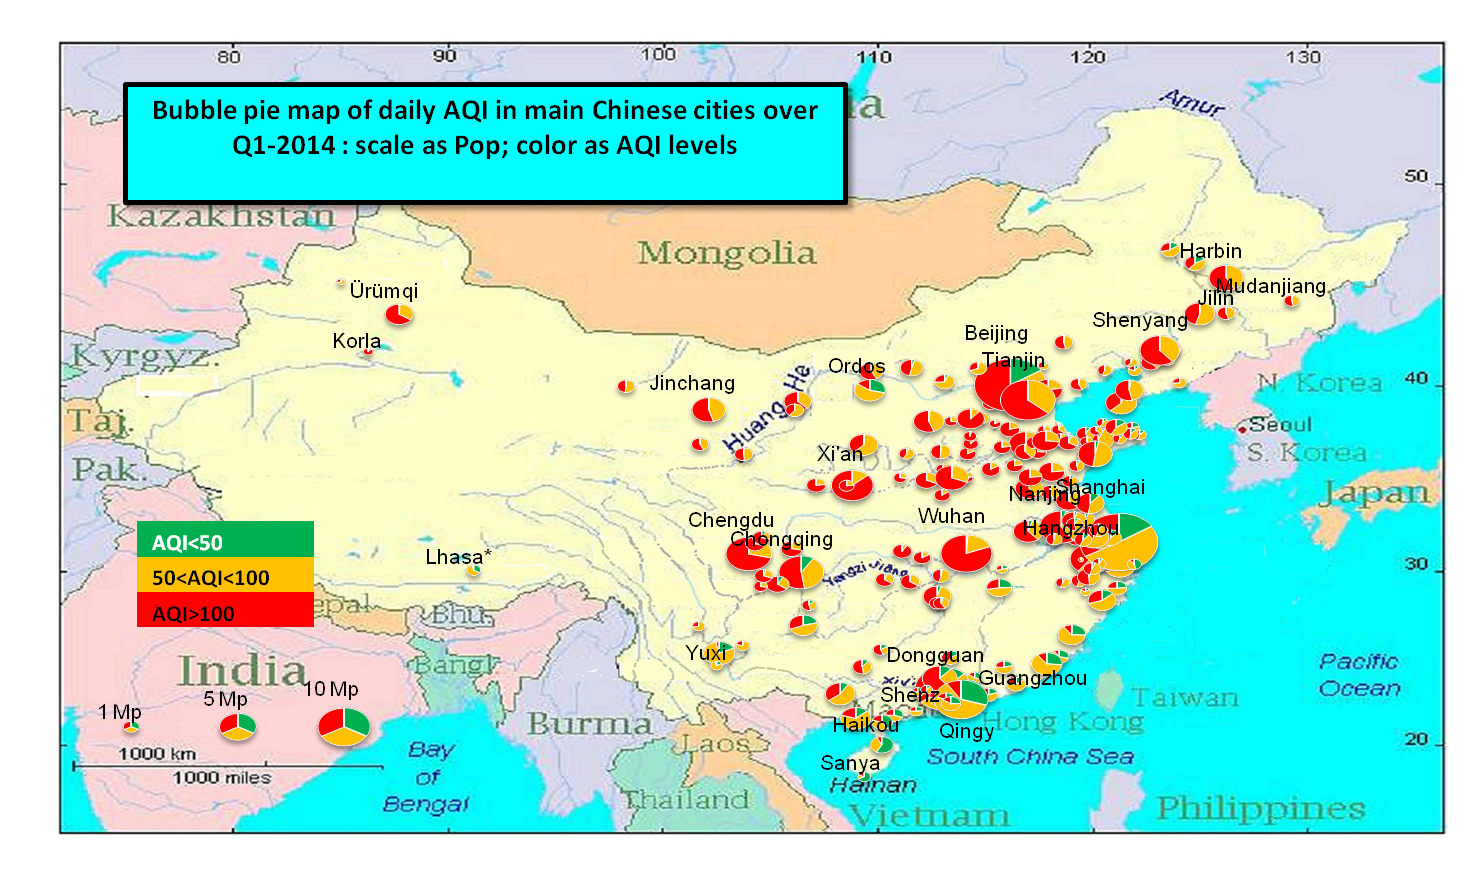
AQI bubble map
is showing during Q1-2014 a concentration of very polluted or unhealthy urban
pollution in Hebei (Shijiazhuang,
Baoding) , Shandong (Zibo), Hubei (Wuhan), Sichuan (Chengdu) and Shaanxi (Xi’an) cities
|
The ranking of the Chinese 190 main cities is
issued each month by the China’s Ministry
of Environmental Protection (see MEP link). It covers an overall population about 416 Mil people in main cities totaling around 63% of Chinese urban population.
Main results from AQI issued by MEP over Q1-2014
Based on the methodology described in my previous posts, the population weighted average AQI overall value over these 190 cities was AQI= 119 during Q1-2014 (90 days).
The population-weighted average daily AQI repartition over these cities - during the period- was the
following :
- 8 days /90 days or 9% where AQI
< 50
-
37 days/90 days or 41% where 50< AQI <100
-
45 days/90 days or 50% where AQI >100
If we arrange these 90 population-weighted averages according to their decreasing daily AQI values, the last day of the first and worst decile-
assuming a lognormal distribution is valid - should be close to 150.
We know that EU is requesting a maximum value of 50 for the last day of the first decile. In average over a year an exposure to AQI
>5O (or PM2.5>35µg/m3) during more than 36 days a year (10%) is considerated as dangerous, due to the cumulative effect -even of a small pollution -on human health over a long period.
U.S. appellation to
qualify the dangerousness same AQI levels in China and USA are used, these appearing to be
more pertinent that the Chine's.
AQI ranking is addressed in decreasing order unlike the
publications from MEP. It is thus rather a "ranking" of Air Pollution
urban areas.
We use the same color convention to represent the various AQI
levels as in our previous posts. Nevertheless we should bear in mind that averaging tends to reduce daily or monthly average over time and cities.
The best
indicator of Air Pollution health hazards is undoubtedly the daily value in each city. We know only AQI repartition inside three intervals: AQI <50; 50< AQI<100 and AQI >100 - although a splitting of the last interval in two would be helpful.
A bubble map of air pollution in China is given above. It gives a good feeling of the AQI situation during Q1-2014. It is nevertheless difficult to read as urban grid is very tight in the Beijing-Tianjin-Hebei area and in coastal regions.
Figure 1 : 30 of the most Air polluted cities are located in a semicircular
area around Beijing, Tianjin, Zibo,
Wuhan, Chengdu and Xi’an
Zooming on the most polluted area is showing that the 30 most polluted cities were located within an semicircular area (see Figure 1 above) , located between the Yangze and the Huang He rivers, which surface is around 1,200,000 km2 or altogether: France, Germany, Netherlands, Belgium and Italy .
Figure 2: China Air Quality Index bubble zooming
the Southern Chongqing-Shanghai-Guangzhou triangle moderate pollution
Figure 2 above is showing "unhealthy for sensitive groups" urban pollution just South to the Yangze river, becoming only moderatly polluted down to the coastal region.
AQI main cities ranking over Q1-2014
Both following Figures 3 & 4 give the AQI ranking of the first two "quintiles" presented by MEP concerning the 76 most
polluted cities :
- 1st quintile: urban population
74 Mil with 38 cities all their AQI but one being either "very polluted" or
"unhealthy”, the largest cities being: Xi'an N°12 (Shaanxi), Chengdu N°24 (Sichuan) and Wuhan N°26 (Hubei) ;
- 2nd
quintile: urban population 81Mil with 38 cities which AQI are all “unhealthy for sensitive groups”, the largest being
Beijing N°42 ,Tianjin N°44, Harbin N°52, Nanjing N°64 (Jiangsu) and Chongqing .
 |
Figure 3: First quintile of AQI ranking of
190 main cities over Q1-2014
 |
Figure 3 : Second quintile of AQI ranking of 190 main cities over Q1-2014
|
Discussion of AQI values on Q1-2014
In general, the main pollutant was PM25
except for some few exceptions where it was PM10.
The result for Beijing, which exhibits 14
days with AQI < 50 when in average AQI = 147 seems quite unlikely, while similar cities for their AQI level - such as Tianjin- are all showing 0-5 days for this
indicator.
Furthermore, comparing the
sub-AQI corresponding to the value of the monthly concentration of PM2.5, to the
monthly value of the AQI (see my last post) it is possible to highlight some possible errors.
This test establishes that 99 values out from 570 (190
cities x 3 months) or 17% might be
inaccurate with an AQI value underestimated in the following cases:
Ma'anshan- in Mar 2014-(underestimation: 24.1 /AQI=108.4); Zhangqiu-Feb- (19.3/149.2);
Langfang- Feb- (14.6/195.3); Ma'anshan-Jan- (12.7/187.78);
Beijing- Feb- (12.0/183.7); Handan- Feb- (10.8/210.2);Tangshan-Feb-(9.71/190.3); Xianyang-Jan- (9.58/194.4); Baoji- Jan-(9.21/173.7)…Xi'an-Jan- (8.48/185.8)…Zibo-Jan- (7.09/185.8); Shijiazhuang-Feb (7/266.0)…etc
As the concerned cities are mosly classified on a monthly basis either "Unhealthy" or "Very Polluted", such AQI underestimation could rock the ranking list and expend the number of "Unhealthy " or"Very Polluted" cities on a quarterly basis, such as Beijing for instance.
|