 |
Figure 1 : In 2011, WHO named Lanzhou as the city with the worst air quality in China. In spring, dust storms choke the city - a product of deforestation, overgrazing and urban sprawl (from Deutsche Welle) |
Inhalable PM10 pollutant (particulate matter with diameter <10 μm) is of primary concern
for most Chinese cities. Concentration of PM10 over China obeys a regional distribution pattern. The location of sources, climate or land changes, may concentrate air pollutants or otherwise facilitate their dispersion.
Combined with unequal inhabitant concentration PM10 regional variations at ground level are leading to different degree of population exposure to PM health hazards.
Combined with unequal inhabitant concentration PM10 regional variations at ground level are leading to different degree of population exposure to PM health hazards.
This is especially difficult
to assess as atmospheric aerosol have marked spatial and temporal variations
due to their relatively short residence time and the heterogeneity of their
sources.
In addition to regional
situation, intense dust storms originating from Mongolia and Kazakhstan deserts may produce clouds of fine dry PM. These occurrences have increased in the
last decade due to industrial pollutants contained in the dust and intensified desertification in Western China.
There have been numerous ground-based studies of PM10 air pollution in China. However, even taken together, most studies do
not provide a systematic picture of the population exposure distibution due to limited
coverage of observations and difficulties in inter-comparing results.
PM aerosol information obtained from satellite measurement
of aerosol optical thickness (AOT) may be useful. However, AOT is influenced by many factors including the vertical structure and
height of the atmospheric mixing layer. Therefore, they will differ from those
of the ground relevant for population exposure.
So far the best approach to this crucial issue in China appears to be a
study of the concentration of PM10 in 86 most important Chinese cities covering
the main inhabited regions. This study has been conducted by scientists from Chinese
and American agencies.
This paper published in June 2010 by W. J. Qu, R. Arimoto & al. is based
on measurements of Air Pollution Index (API) carried out by the Environmental Protection Agency of China (EPA-China) from June 2000 to February 2007.
Reconstruction of PM10 concentration from air pollution index (API) readings in 86 major Chinese cities
As explained in my post dated 16 July 2013, Air Quality Index (API) in Asia are established
following rules very similar to the US Air Quality Index including the reading of the 5 pollutants:
PM10, O3, CO, SO2 & NO2. The only difference with US AQI is that very fine PM2.5 pollutant (particulate matter with diameter <2.5 μm) are missing from pollutant list which downplay the true harm done from all PM.
In China, the 5 pollutants reported daily for each city are continuously
measured at several monitoring stations in different types of areas
(commercial, cultural, downtown, residential, traffic, industrial, etc.) and at
a clean background station.
The daily average concentrations of these pollutants are then computed
from the measurements made at all of the stations. A sub-index is calculated
for each pollutant with a dimensionless number from 0 to 500. The maximum sub-index
is then reported as the API for the city and day and the concerned pollutant as
the "primary pollutant".
PM10 being most of the time the primary pollutant, it means that the value of API as monitored
by EPA-China can be used to reconstruct the PM10 of the city and day.
API records for 86 major Chinese cities spanning from June 2000 to February2007 (available at State Environmental ProtectionAgency) were used in the W. J. Qu,
R. Arimoto & al. June 2010 study. PM10 concentrations were calculated only for days when PM10 was the
principal pollutant, all together accounting for 91.6% of the total 150,428 recorded
days.
These results were then used to study the spatial
variability of PM10 in the 86 Chinese cities.
Location of the 86 Chinese cities and grouping of 14 clusters of cities according to their APIs
A fuzzy clustering procedure was used to determine which cities were
strongly correlated together in their APIs. These cities were defined as part
of a cluster of cities behaving closely together as concerns their APIs.
Through these procedures, 83 cities in Midwestern China (longitude 100°
E to 130° E) were divided into 14 clusters (Figure 2) corresponding more or
less to provincial regions with some exceptions. For instance Hohehot (HHT) in Inner
Mongolia and Datong (DT) in Shanxi province both located on the Northeastern margin of the Great Bend of the Yellow River were assigned to
group G03. Or Dalian city from Liaoning province assigned to G03.
The 14 city clusters were further separated in 3 latitudinal
Northern (blue), Middle (green) and Southern (orange) zones.
In addition, 2 cities in
Xinjiang Uyghur and one in Tibet in Western China (83-91°E) were included in
the sample adding up to 86 cities all over China.
 |
Figure 2 : Location of the 86 Chinese cities for which data are available; colored frames are showing the separated in 3 latitudinal: Northern (blue), Middle (green) and Southern (orange) zones |
The full name of the 86 cities are listed in the followings Figures 3, 4 & 5.
The Northern zone (north of 33 °N, Figure 3) includes 38 cities with an urban population of 110 Mil people (2010 census).
 |
Figure 3 : 8 Northern G01 to G08 clusters over 38 cities/109 Mil people |
 |
Figure 4 : 3 middle G09 to G11 clusters over 26 cities / 103 Mil people
|
The southern zone (south of 28°N) contains 19 cities with an urban population of 54.5 Mil ((2010 census). Contrary to Northern and Middle zones containing two basins oriented East-West, the Southern zone is mainly a hilly area.
 |
Figure 5 : 3 Southern G12 to G14 clusters over 19 cities / 55 Mil people plus 3 Western cities: altogether totaling 86 cities /270Mil people |
Computing the PM10 population exposure
The above study provides some
information on concentrations of PM10 in each city during the period June 2000
- February 2007. But it does not give the correct average value for all 86 cities over the period. Instead, each city is listed within six growing ranges of PM10 concentration between
36 and 193μ g/m3 (see Figure 6 below extracted from WJ Qu, R. Arimoto and al.).
 |
Figure 6 : Distribution of PM10 ranges over the 86 cities (from W. J. Qu, R. Arimoto &al. ) |
Nevertheless the study above highlights - among the14 groups of 86 cities - the average concentrations in 31 cities where PM10 pollution had been the highest during these periods.
Finally it provides the average concentration of PM10 respectively in each of the 14 groups and the 3 major geographic zones (see also Figure 9 below). But- and this is an important issue in terms of population exposure- it is the arithmetic mean value, each city having the same weight regardless of its population.
In order to obtain the average concentration of the missing 86-31= 55 cities which exact values are not published, we have extracted a complete set of city average concentration by adjusting the average concentration of the 55 missing cities inside their range values while meeting the arithmetic mean of the 14 groups .
So a set of detailed yearly average PM10 concentration at city level were obtained and Figure 7 below is showing the result in term of population weighted mean what is the exact population exposure to PM10 pollution in the 14 clusters of cities.
 |
Figure 7 : Distribution of PM10 population weighted exposure over the 14 clusters of cities |
This was expected since the most populated urban areas are also often the most polluted.
Cities' yearly PM10 population exposure
Using the detailed average PM10 concentration at city level, it is then possible to sort out the 86 cities according to their decreasing PM10 average concentrations over Jun. 2000 to Feb. 2007 with the cumulated urban population (see the "monotonous yearly PM10" in the following Figure 8).
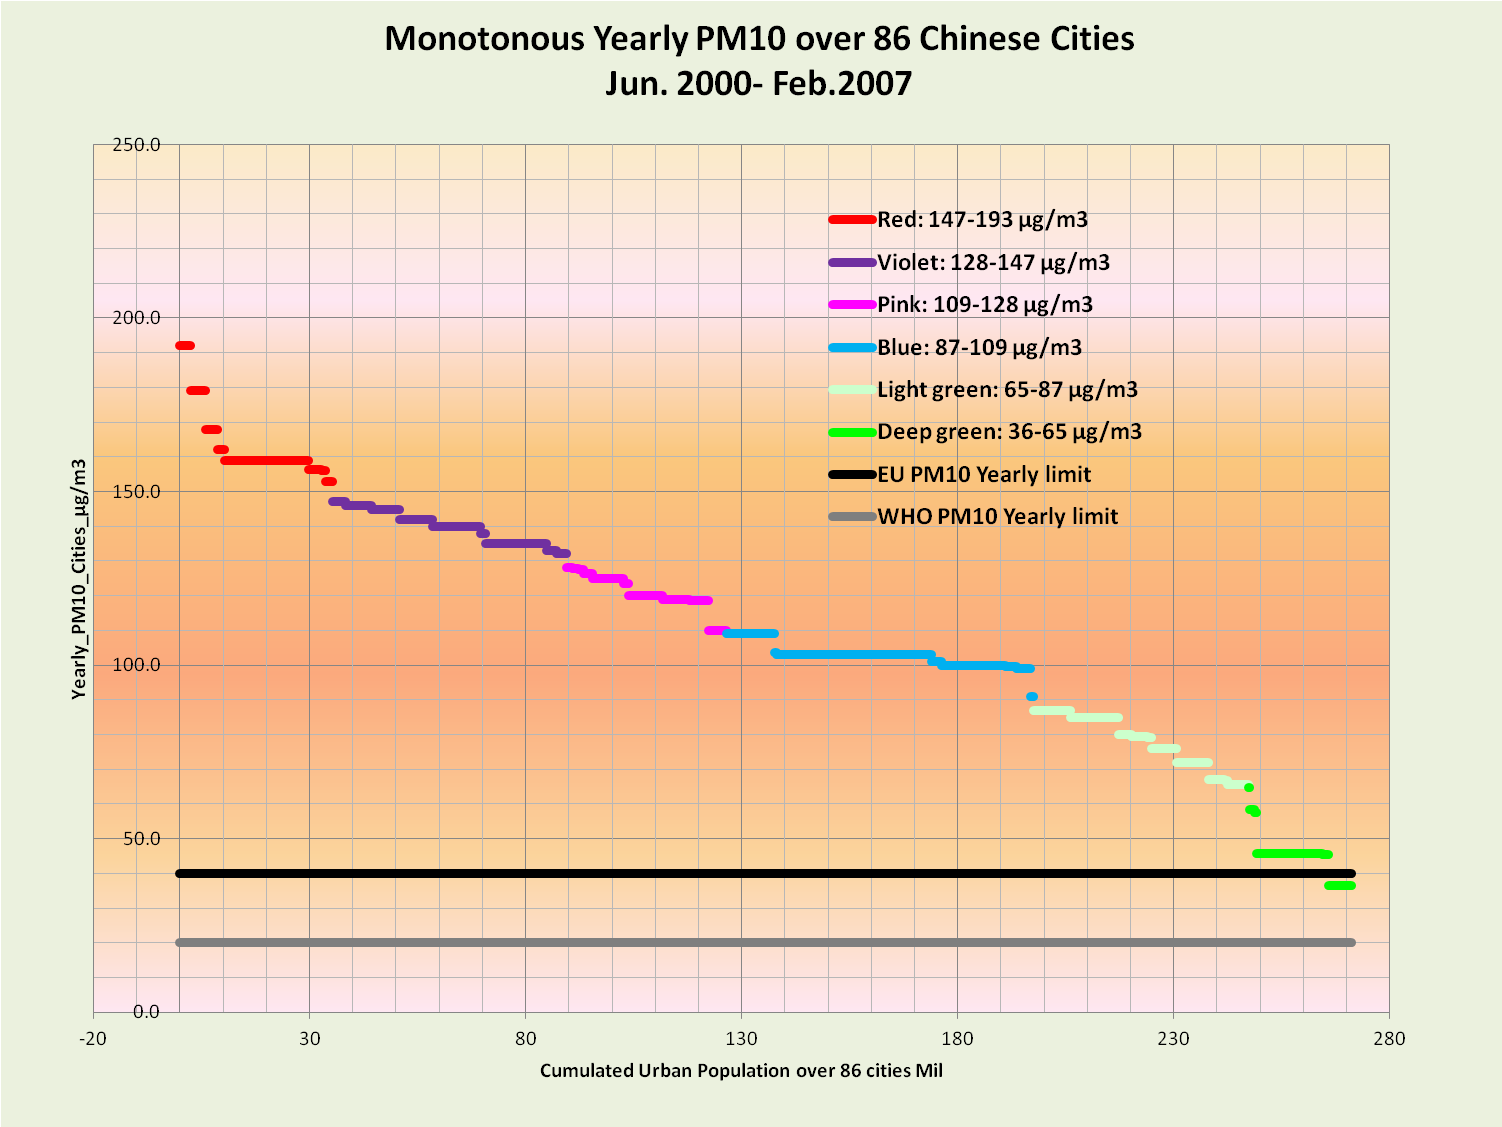 |
Figure 8 : 86 Cities classified with decreasing value of PM10 exposure and cumulated urban population |
We see so clearly the enormous weight of the pollution of cities having more than 5 Mil inhabitants in the curve: Beijing (19.3 Mil / 159 μg/m3), Xian (6.5 Mil/144 μg/m3), Chongqing (7.4Mil/142μg/m3), Tianjin (11.1 Mil/140 μg/m3 ), Wuhan (9.8 Mil/135 μg/m3), Shanghai (22.3Mil/103 μg/m3), Suzhou (5.3 Mil/103 μg/m3), Guangzhou (11.1Mil/85μg/m3) and Shenzhen (10.4 Mil/46 μg/m3).
All cities are far above the WHO and EU yearly limits that are respectively 20 & 40 μg/m3 as explained in my post dated 16 July 2013.
The average population weighted PM10 is 109μg/m3 (see Figure 7) and the Chinese population exposure in the 86 most important cities is around 2.7 at 5.5 times EU and WHO yearly maximum limits.There are 9 cities with PM10 in the range: 153-192μg/m3 ( “Red cities “) and 12 cities in the range: 128-147μg/m3 (“Violet cities”) as shown in the Figure 9 below:
 |
Figure 9: The 21 most polluted cities (from W. J. Qu, R. Arimoto & al. ) |
There are
only 4 Cities meeting the EU maximum 40μg/m3 yearly limit, that is about 2% of the 86 cities total population. They are all in G13: Beihai (BH); Guilin (BH); Haikou (HK) & Zhanjiang (ZhaJ).
Variation of daily PM10 concentration
We know (see my post dated 16
July 2013) that the annual average in each of the 86 Chinese cities is
insufficient to assess the health hazards associated with breathing high level
of PM pollutant during an extended period.
It is necessary to limit as
much as possible the number of days during the year when the concentration is
above a maximum threshold. Or - which is exactly the same- to verify that
during most of the time PM10 is lower than this maximum limit.
For EU: PM10 should be lower
than 50μg/m3 during at least 90.4 % of days over 1 year.
For USA: PM10 should be lower than 150μg/m3 during at least 99.9 % of days over 3 years.
It means that for EU PM10>50μg/m3 is accepted only during 35 days per year, and for US PM10 could be higher than 150μg/m3 only during 1 day over 3 years.
For Chinese most important cities the range of probability for both 50 and 150μg/m3 thresholds are also given in the study from W. J. Qu, R. Arimoto & al.
So we can sort out the 86 Chinese cities by decreasing occurrences ranges for the 2 daily pollution limits (50 & 150 μg/m3) with the cumulated populations (see Figure 9 below). Its means that we select in first the cities with the highest concentration occurences (see the "monotonous occurence days " in the following Figure 9).
 |
Figure 9 : Probability of days with PM<50 or <150 μg/m3 (from W. J. Qu, R. Arimoto & al. ) |
Considering the EU daily PM10 limit that is 35 days only with pollution exceeding 50μg/m3 over 1 year : The 86 Chinese cities have 8 to 10 times more days when the daily pollution exceeds 50μg/m3, which is about 250-300 days for the less polluted and 330-360 days for the most polluted cities.
Considering the US daily PM10 limit that is 1 day only with pollution exceeding 150μg/m3 over 3 years : Chinese cities have 25 to 500 times more days when the daily pollution exceeds 150μg/m3, which is about, 1-55 days for less polluted cities and 400-540 days for the most polluted.
Discussion
Deriving PM10
from API readings introduces mechanically reduction on daily PM10 records
When daily API readings are less
than 50 or more than 500, daily PM10 values are either set to zero or 600μg/m3. So daily low PM10 are supposed to be zero and high readings are decreased!
4 cities recorded more than 10 days when API =
500. These were: Lanzhou (47 days), Ürümchi (36 days), Xining (24 days) and
For the days when PM10 was
principal pollutant and the API was reported as 500, the PM10 could be well above the upper limit for the air quality classification of “high-level
pollution” (600 μg/m3).
Such high particulate loading can occur during severe dust storms in some
northern cities. However, in the study, all of the API records of 500 were set
to PM10 at 600 μg/m3!
As published by Associated Press on Oct. 21 2013 “Super smog in northern Chinese city of
Harbin: The density of very
fine particulate matter, PM2.5, used as an indicator of air quality was well
above 600 - including several readings of exactly
1,000μg/m3 for several monitoring stations in Harbin (...). They were the first
known readings of 1,000 μg/m3 since China began releasing figures on PM2.5 in January
2012, and it was not immediately clear if the devices used for monitoring could
give readings higher than that”.
The size of the cities in China is a problem
We have 14 city clusters
on half the Chinese territory which is around 320,000 km2 in each cluster and about the
size of Poland. But the selected cities are also quite big covering around
20-25% over each cluster, with average area spanning from 50,000 to 80,000km2.
If we take Qirihar
for example in G04 which is a prefecture-level city: the total area of its 8 districts and 8 counties amounts to 42,400km2 – the size of Denmark or Switzerland and bigger
than Belgium!- with a density averaging from 76 to 2,716 people per km2 (average
126). Is it possible to average the various API or PM10 readings?
Or Dalian in G06
which is a major city and port with a total area of 12,574km2 –about 5 times
the size of Luxembourg- with 9 districts and one county and a density averaging
from 26 to 3,900 people per km2 (average 470). Is it possible to assume that
the high density areas are similar to the low density’s?
On large areas it
is necessary to have more densely located readings and be able to simulate the
variation of PM10 inside a grid at least 10x10 km2.
Moreover it
is necessary to compute the population weighted average
If we want to be
able to compute the real population exposure then we should be able to localize
the population at least with a grid of 1x1 km2. If we had a smaller grid we
might have much higher value of population exposure.
The daily average concentration is more meaningful than the yearly average
The real unsafe limit from
PM10 occurs when exceeding a daily limit over a period of days or weeks. WHO is
suspecting that no threshold for PM has been identified below which no damage
to health is observed.
In the 86 Chinese cities, the daily population
exposure are 10-100 times higher than the exposures normally accepted following EU or US standards. The
reason is that the daily limits are much more difficult to meet.
Thus the overall picture is
extremely severe for the 86 Chinese cities if reference is made to daily limits
in Europe and the USA.
No comments:
Post a Comment