 |
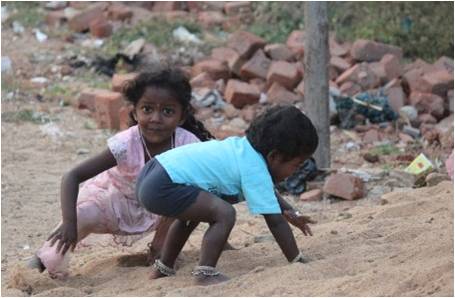
Figure 1 : At the beach in Chennai Indian kids playing among waste |
As in all countries the main drivers of Mother India’s biocapacity are its climate, land area, and population size. India is over a land area about one third smaller than China with a population about the same size. As a result Indian biocapacity is less than 50% of Chinese one. Australia’s land area is roughly twice as big as India, but with a much smaller population: its biocapacity is half that of India. Biocapacity is the ecological wealth of nations.
Why biocapacity matters for current economic boom?
 |
Figure 2 : Main Asian Pacific countries with middle income per capita |
We know that every country needs food, timber, waste treatment and other bio-services to meet the final demand of its citizens. This is called the “ecological footprint” of the country and measured by the area of cultivated land, forestry or fishing grounds required to produce the bio-services.
On the
other hand, each country has within its borders farmland, forest, wetland or fishing grounds which are able to supply bio-services meeting all or part of its footprint: this is called the “biocapacity
“of the country.

Footprint and biocapacity respectively characterize the demand and the
supply side of each country bio-services' exchange. Both are expressed in global
hectares (gha) at the country level as in Figure 3 above, or in global hectare per person as in Figure 4 below.
The excess of country’s demand footprint over its supplied biocapacity is procured by other countries’ biocapacity and is an ecological debt. When the overall demand is greater than the Planet biocapacity then we may have modification and disruption of climate conditions.
The excess of country’s demand footprint over its supplied biocapacity is procured by other countries’ biocapacity and is an ecological debt. When the overall demand is greater than the Planet biocapacity then we may have modification and disruption of climate conditions.
 |
Figure 4 : Unit Footprint and Biocapacity from main Asian middle income countries from the last WWF Living Planet Report |
In 2008 the ecological debt expressed in % of biocapacity over main Asian middle income countries was distributed as follows : Mongolia -64% (excess); Indonesia -14% (excess) ; Malaysia
56%; Philippines 60%; India 81%; Thailand 105%; China 145% and Sri Lanka 157%. India in 2006-2008 had improved its debt which was around 100% in the previous years. China and India the heavy weights of the Asian Pacific region are highly indebted.
Yale University has
published its 2012 ranking of EPI Environment and Pollution Index, across
132 worldwide countries. India is ranked according to the index of
pollution & environment (EPI) as the worst performing countries in Asia Pacific just after China (see my post dated 6 Nov 2012).
The groundwater quality is very poor and only 33% of households have a toilet. Jairam Ranesh Minister of Rural Development said in The Telegraph that "Nearly 60 % of the people in the world who defecate in the open belong to India. Even countries like Bangladesh, Nepal, Pakistan and Afghanistan have better records." Now his department is emplementing the Nirmal Bharat Abhiyan Program (NBA) to achieve complete sanitation with a budget of 3500 bil INR on 2012-2013.
The following curves (see figure 5) established by the Confederation of Indian Industries (CII) and Global Footprint Network are showing that Mother India is depleting its ecological assets in supporting the current economic boom – a doubling of GDP per capita since 2000- and the growth of its population.
All travelers in
India are struck by waste eyesores littering streets, roads and beaches (see
Figure 1). It was only in 2000 that Indian authorities decided to exercise their power
under the Environment Protection Act of 1986. Almira Patel in Bangalore introduced an
action into the Supreme Court when she noticed that frogs
stopped singing, on her lovely village road outside Bangalore. They were all dead because the city
was dumping its garbage in water lakes and wetlands. After an investigation by the Supreme Court it was only in 2005 that the
Indian Government provided funds to tackle the problem of solid waste collection.
The groundwater quality is very poor and only 33% of households have a toilet. Jairam Ranesh Minister of Rural Development said in The Telegraph that "Nearly 60 % of the people in the world who defecate in the open belong to India. Even countries like Bangladesh, Nepal, Pakistan and Afghanistan have better records." Now his department is emplementing the Nirmal Bharat Abhiyan Program (NBA) to achieve complete sanitation with a budget of 3500 bil INR on 2012-2013.
The following curves (see figure 5) established by the Confederation of Indian Industries (CII) and Global Footprint Network are showing that Mother India is depleting its ecological assets in supporting the current economic boom – a doubling of GDP per capita since 2000- and the growth of its population.
 |
Figure 5 : Indian footprints are biocapacity over 1961-2003 from Confederation of Indian Industries CII and Global Footprint Network India’s Ecological footprint report |
Rapid population growth over 1961-2003 has been done
with Indian unit footprints more or less stable but with a huge dwindling biocapacity
dropping around 46%. This means that more and more people are sharing a limited amount
of biocapaity.
Pressure from croplands are depleting forests’ biodiversity
The majority of India’s biocapacity is cropland. Other
land types, such as forest and grazing land, while used by humans also serve as
the habitat for a variety of endangered species, such as the Bengal tiger.
As the need to feed more people grows, pressure will
increase to convert forest to cropland.
This competition for biocapacity could
be devastating to the remaining forest species and biodiversity.
There is already
an extremely low forest cover ratio at 23% of land area and India is pondering an
increase up to 33% but chances are very low because most enforcements are done at
regional or local level.
In addition to loss of habitat for wild species,
conversion will also reduce the capacity of forests to provide ecological
services such as carbon sequestration, freshwater collection, and erosion
control in mountainous regions.
Indian Ecological Debt
India’s Human Development Index score increased from
0.4 to 0.6 over the past 30 years - 0.8 being the threshold of high development-
but a growing ecological debt and a bad water use management put this
improvement at risk.
People living
at lower-income levels are likely to be more affected by the growing ecological
debt than those at higher income levels. While wealthier individuals are
more likely to have sufficient income to purchase imported food and goods to
meet their needs, poorer communities often depend more directly on local
biocapacity, and thus are more impacted by the health and productivity of these
ecosystems.
 |
Figure 6 : India’s Ecological debt on the Planet biocapacity from CII and Global Footprint Network India’s Ecological footprint report |
The ecological debt situation has improved somewhat in
2003 -2008 with a slight reduction from 100% to 85-90%, but will this trend prove to be stable?
Climate change is an example of ecological debt on a
global scale that affects India directly.
Already, warming temperatures are
causing glaciers to melt in the Himalayas, altering the flow rates of many of
India’s most important rivers, causing increased landslides and flooding such
as that which displaced one million people in the northern state of Bihar in 2008.
In addition, global warming can produce shifts in the
growing seasons for major crops such as rice, which production could fall by
as much as 40%. The Indira Gandhi Institute of Development Research has
projected that future climate-related factors could cause India’s GDP to
decline by up to 9%.
Water conservation is a driver for Indian Biocapacity
India is blessed with the Himalayan range proximity including
over a hundred mountains exceeding 7200 meters across five countries: Bhutan, India, Nepal, China, and Pakistan, the first three countries having sovereignty over
most of the range.
Three of the world's major rivers, the Indus, the Ganges, and the Brahmaputra all rising near Mount Kailash in Tibet China, are crossing and encircling the Himalayas.
Three of the world's major rivers, the Indus, the Ganges, and the Brahmaputra all rising near Mount Kailash in Tibet China, are crossing and encircling the Himalayas.
As a result India has the largest total Water output of any country in the world, adding up to 987 bil m3/year. Yet, its water use per capita is only around 900 m3 per person less than many countries with similar or higher per capita income (Indonesia 1400 ,
Thailand 2300 but China 700).
The nation’s cropland output and
efficient use of water are lagging far behind technical potential. Forty
years after the Green revolution, many experts argue that India’s population is
growing faster than its ability to produce staples such as wheat and rice. Indian Government has not expanded
irrigation or agricultural research since the 1980s and groundwater has been depleted at alarming rates in Punjab for example.
All these are due to bad water conservation, reduction of soil quality and biodiversity, decline of groundwater level in critical region. An Integrated Watershed Development Program (IWDP) to restore water balance, soil and cover is being implemented by the Ministry of Rural Development with a budget of 2744 bil INR in 2012-2013. This is part of a overall action plan for Greening Rural Development in India.
All these are due to bad water conservation, reduction of soil quality and biodiversity, decline of groundwater level in critical region. An Integrated Watershed Development Program (IWDP) to restore water balance, soil and cover is being implemented by the Ministry of Rural Development with a budget of 2744 bil INR in 2012-2013. This is part of a overall action plan for Greening Rural Development in India.
Will India have sufficient economic reserves to
compete for the biocapacity needed to support its population in the future? The
costs to the Indian economy may grow when the laws of supply and demand put a
higher value on the biocapacity available in nations that have an ecological
reserve.
South North Water Transfer
Project (SNWTP) in China is an example of the resulting growing competition between nations for controlling available biocapacity
(see my post dated 12 Nov 2012).
China is lagging with 700 m3 of water per person after Indian because
of Chinese water shortage. Large-scale water transfers have long been
discussed by Chinese authorities as a solution to the country's water shortage as
the South-North Water Transfer Project.
In a book titled "Tibet's Waters Will Save
China" a group of Chinese ex-officials have championed the northward
rerouting of the waters of the Brahmaputra as an important lifeline for China
in a future phase of South-North Water Transfer Project. Such a diversion will fuel tension with India and Bangladesh if no prior
agreement is reached on sharing the Tibet's water.
No comments:
Post a Comment