Wednesday, November 21, 2012

Fresh water environment in China: an overall grim situation with apparent slight amelioration on lakes from a poorly documented report

Figure 1 : Siberian and White-naped Cranes near Poyang Lake from birding2asia.com

Main information discussed in this Post are issued from the 2011 State of the Environment Report (SOE) published on 25th of May 2012 by the Ministry of Environmental Protection. The 2011 SOE is less detailed as the previous 2009 & 2010  issues and is not published in English. This makes comparisons more arduous.
Water resource has always been a problem in China particularly in the region north from the Yangtze River where only 19.1% of  resource from rain is falling. In the past 50 years, water overexploitation has almost dried up the Yellow River's valley. In 1997, the lower Yellow River did not flow during 230 days. Increased erosion and sedimentation, especially on the Loess Plateau, have made the river much less navigable.

Figure 2 : China main rivers 
Continuous emissions from manufacturing industries and industrial spill hazards are the largest contributor to lowered drinking water quality across the People’s Republic; introduction of poorly treated sewage and extensive use of agricultural fertilizers and pesticides have proven to be major contributors as well.
These water quality issues coupled with seasonal scarcity of water may spark endemic water shortages, which frequently affect millions of people.

Main river systems

China uses a six-grade classification scheme for water quality. Grade I & II are the best. Water no worse than grade III can be used for drinking, although sometimes treatment is required. Grade V can be used for irrigation. Water less than grade V cannot be used for irrigation. Nevertheless according to criteria used by the UN Environment Program, both grade V and less than V are unfit for drinking, aquaculture, industrial use and even agriculture.

The 2011 State of the Environment Report (SOE) underlines that the quality of specific rivers systems is deteriorating from South to North as follows (see Figure 3):
  • The Pearl River and the Yangtze River systems have "good water quality";
  • The Huaihe River, and the Yellow River systems have “ poor water quality";
  • Both the Haihe River flowing through Beijing and Tianjin and the Liaohe River systems are "badly polluted".
  • The Songhua River is "moderately polluted".
In order to appreciate variation from the previous 2 years we have dismissed additional river systems   (Zhejiang and Fujia, Southwest and Inland river systems). Figures 3 & 4 concentrate on the major systems which were already in the 2009-2010 review.
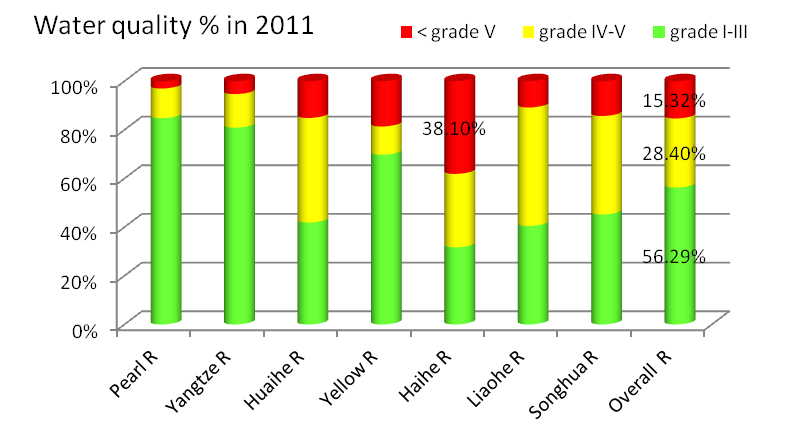
Figure 3 : Quality grading of the seven major river systems in 2011
The Yellow River Conservancy Committee, which surveyed more than 8,384 miles of the river in 2007, said 33.8% of the river system registered worse than grade V. The report said waste and sewage discharged into the system totaled 4.29 bil tons. Industry and manufacturing provided 70% of the discharge into the river, with households accounting for 23% and just over 6% coming from other sources.
The 2005 Jilin chemical plant explosions in Jilin City caused a large discharge of nitrobenzene into the Songhua River and the entire water supply to Harbin city  was cut off for five days though it was only after 3 days that officials admitted that a severe pollution incident was the reason for the cutoff.

Figure 4 : Variation of major river system water overall quality from 2009 to 2011


As it can be seen on Figure 4, for all major river systems across around 400 river sections under national monitoring, overall river quality does not really improve over the last 3 years. 

It should be noted that grade V is not documented in the current SOE report and was around 25% of Grade IV-V in 2009-2010 and even more for the Yellow River. 

As a result  we can presume under UN Environment criteria that grade V or less unfit even for agriculture and industrial use which registered  around 33% in 2007 are still currently around 22-24% which is a very grim water quality.

Lakes and fresh water reservoirs

Among the 26 key lakes and reservoirs under national monitoring program, quality ranged as shown in Figure 5. Apparently the quality has improved from the previous 2009-2010 years with a two fold increase of grade I-III.  But it should be noted that no detailed documentation was provided in 2011 on each lake or reservoir quality as it was the case in the previous two years. This lack of detailed information- as data are improving much- is extremely worrying.

The main pollution indicators were total phosphorus, and chemical oxygen demand (total Nitrogen does not participate in water quality evaluation).
Figure 5 : Overall quality grading of major lakes and reservoirs 2009-2010-2011


Addition of nutrients such as nitrogen and phosphorus through fertilizer or sewage discharges are the determinant of the eutrophic state of a reservoir. The increase of nutrients causes the proliferation of plants and living organisms such as algae or phytoplankton. 

Lakes are usually classified as being in one of three possible classes: 
  • oligotrophic  (little or no aquatic vegetation) , 
  • mesotrophic (commonly clear water)
  • eutrophic (large quantities of organisms, including algal blooms)  

Figure 6:  Trophic state index (TSI) of major lakes and reservoirs in 2011

Among the 26 lakes and reservoirs (see TSI in Figures 6 & 7) a majority of lakes or reservoirs are under eutrophic state: 8-11% under heavy (HE) or intermediate (IE) and 42-46% under slight (SE) eutrophic state. Only 46% are posting mesotrophic (ME) level in 2010-2011 in reduction from 2009.  Currently only a minority of lake have clear water with little or no aquatic vegetation.


Figure 7 : Overall TSI of major lakes and reservoirs 2009-2011


Compared during the previous years the TSI shows a variation among the monitored water bodies:
  • Reduction of eutrophic state: Dianchi Lake improved from heawy  to intermediate,  Donghu  Lake from Intermediate to slight  eutrophication. 
  • Raising of state: from slight to intermediate both Yuqiao  and Songhua reservoirs.
There have been a high number of river pollution incidents in recent years in China, such as drinking water source pollution by algae in the Taihu Lake  in May 2007. It was reported that a "bloom of blue-green algae that gave off a rotten smell" shutting off the main water supply to 5.8 mil people. By October 2007 the Chinese government told it had ordered 1,300 factories around the lake to shut down. However, Wu Lihong, one of the leading environmentalists alleged in 2010 that not a single factory was closed. Jiangsu province planned to clean up the lake and chaired by Wen Jiabao the State Council set a target to clean Taihu lake  by 2012.  However, in 2010 The Economist reported that a fresh pollution outbreak had occurred, and that Wu, released from prison in April, was claiming that the government was trying to suppress news of it, all the while switching to other supplies in place of lake water.

Ground water quality in Cities

Ground water as opposed to surface water (river and lakes) is located beneath the earth in aquifer. Ground water in cities is more affected by pollution than China’s rivers and lakes.

In 2010-2011, 182-200 cities across the country had been carrying out a ground water quality monitoring on a total of 4100-4700 points. The drink water classification is organized with the following 5 levels: excellent, good, almost good (to a better level…), poor, very poor. 

National groundwater quality situation is stable at a very alarming level with a majority of monitored points which have poor or very poor levels: together 57% on 2010 and 55% on 2011.  
Water quality is excellent - good – almost good (to be better…) only for 43% in 2010 and 45% in 2011. The odd level almost good (to be better…) is around 5% on both years.

Deteriorated water quality in the city are mainly concentrated in the north, northeast and northwest regions.

Figure 8 : Quality level of underground water in Chinese cities


Chinese environmental activist and journalist Ma Jun warned in 2006 "In the north, due to the drying up of the surface water, the underground water has been over-extracted. The water shortage in the north could have drastic affects because almost half of China’s population lives on only 15 percent of its water. The situation is not sustainable. Though the south has abundant water, there is a lack of clean water due to serious water pollution. Even water-abundant deltas like the Yangtze and the Pearl River suffer from water shortage”.
According to an article in the Guardian, in 2005, Pan Yue, deputy director of the state environment protection agency, warned that economic growth was unsustainable due to the water problems. In 2004 the World Bank warned that the scarcity of the resource would lead to "a fight between rural interests, urban interests and industrial interests on who gets water in China."


Water conservation and transfer projects


Three Gorge 22,500MW power dam, by reducing coal consumption, increasing Yangtze's barge capacity avoids tons of Green house gas. An important function of the dam is also to control flooding major problem of Yangtze River and thus increase the water available during the dry season. The reservoir's flood storage capacity is 22 km3 which is almost 50% of all major and key lakes discussed above. 

But the mere size of the reservoir -660 km length x1.12 km width- implies a huge ecological and human cost:  

  • The land in the area is experiencing erosion, absence of silt downstream will cause riverbanks to become more vulnerable to flooding including Wuhan, Nanjing & Shanghai more than 1,600 km away. 
  • Much of this Yangtze sediment is now settling in the dam instead of flowing downstream; less benthic sediment downstream will cause biological damage and reduce aquatic biodiversity.
  • The region is home to 6,388 species of plants of which 57% are endangered. Around  361 different fish species are living in the Yangtze River basin accounting for 27% of all endangered freshwater fish species in China. The dam contributed to functional extinction of the Baiji Yangtze river dolphin. From the 3,000 to 4,000 remaining critically endangered Siberian Cranes, a large number currently spend the winter in wetlands destroyed by the Three Gorges Dam. As of June 2008, China relocated 1.24 mil residents about 1.5% of the province and Chongqing Municipality population on which about 140,000 were relocated to other provinces. The 600km long reservoir flooded some 1,300 archaeological sites and altered the appearance of the Three Gorges as the water level rose over 91 m; heritage relics are being moved to higher ground as they are uncovered, but the flooding inevitably covered undiscovered relics. Some sites could not be moved because of their location, size, or design.


As concerns the ecological cost only, the question is whether the reduction of footprint (less CO2 released and more fresh water available) resulting from Three Gorge Dam are greater than the cost in biocapacity reduction resulting  from endangered wetlands, biological damage, plant and animal wildlife extinction. The only fact that the cost of the loss of ecological capital that can never be replaced is beyong assessment provides some clue.


South North Water Transfer Project (SNWTP): Large-scale water transfers have long been discussed by Chinese authorities as a solution to the country's water shortage. The South-North Water Transfer Project- the Eastern Route or Grand Canal revamping-  is being developed primarily to divert water from the Yangtze River into the Yellow River and Beijing.
The development or diversion of major rivers originating from China but flowing mostly across Chinese boundaries, such as the Brahmaputra River and the Mekong River, could be a source of tension with Vietnam South North Water Transfer Project and Thailand. In a book titled "Tibet's Waters Will Save China" a group of Chinese ex-officials have championed the northward rerouting of the waters of the Brahmaputra as an important lifeline for China in a future phase of South-North Water Transfer Project. Such a diversion could fuel tension with India and Bangladesh, if no prior agreement would be reached on sharing the river's water.


Tuesday, November 6, 2012

Yale 2012 Environment Pollution Index in Asia-Pacific: New Zealand, Japan, Malaysia are best “strong performers”, but Indonesia, China, India most populous countries are among “weak performers”


Figure 1 : Last child who contracted polio in India (globalgiving.org)

Yale University has published its 2012 ranking of EPI Environment and Pollution Index, across 132 worldwide countries. The data concerning the 20 Asian-Pacific countries are summarized below (see Figure 2).


Figure 2: Asian-Pacific countries 2012 EPI and Trend 

Methodology


For each surveyed country EPI index is compiled from the two composite indices as follows:


The index EH “Environmental Health” describes pollution effects on human health notably from air (air pollution and particles), water (drinking water & sanitation) and the environmental burden of disease (Child mortality as a proxy). EH accounts for 30% in the EPI, the most important parameter being child mortality a proxy for underlying environmental conditions which amounts for half inside EH.

The index EV “Ecosystem Vitality” reports effects of pollution on nature ecosystems: water resources, biodiversity, forests, marine habitats, agriculture and climate change drivers (CO2, renewable). This component accounts for 70% in EPI index the most important parameters being biodiversity and climate change, each amounting for a quarter inside EV. 

These relative contributions of EH versus EV do not reflect the prioritization of nature indicators over environmental health, but rather a wish to better compound contributions inside EPI, because standard deviations are twice bigger for EH than for EV (see following Figures 4 & 5).

The raw data values are transformed by dividing by population, GDP, or some other denominator in order to make the data comparable across countries. Then a logarithm transformation is applied, allowing EPI to reflect important differences not only between leaders and laggards, but among best-performing leaders as well.

Asian-Country 2012 EPI 


Figure 2 above shows that the 20 Asian-Pacific countries are moderately effective when compared to the worldwide survey: 


  • There is no Asian-Pacific country among the 10 "Strongest performers" which are mainly 9 European countries- the first being Switzerland- and Cota Rica (5th).


  • 9 Asian-Pacific countries are among the “strong performers” which first 3 are: New Zealand (14th), Japan (23rd) and Malaysia (25th). 


  • 4 countries are  “modest performers” on which 2 developed countries Australia & Singapore.


  • 7 countries are “weak performers”. It is worrying that the three most populous countries: China, India and Indonesia, which concentrate 74% of the population in Asia-Pacific region have such weak performance.

Figure 3: Asian-Pacific countries 2012 EPI and Trend dynamic

There is however a positive upside (see Figure 3). No country in the area is among the last 12 worldwide “weakest performers”. The trend is favorable since among the 20 Asian-Pacific countries under survey, 11 countries have a strong positive EPI trend over the period 2000- 2010 (North East quadrant in Figure 3).


Figure 4: Asian-Pacific country Environmental Health Composant

In Asia-Pacific region the first emerging country is Malaysia which as compared to New Zealand shows good results on Agriculture and Biodiversity but should improve on EH (Environmental burden of disease and Water) and EV (Climate Change and Forests).

The ranking is misleading for countries with very small land area: Singapore is number one for the EH, but because it has a limited land surface is the last EV ranked Asian-Pacific countries.

Among the developed countries, Australia  is very weak on EV because Agriculture, Air pollution on Ecosystem, Climate Change and Forest parameters have low performances.

Figure 5: Asian-Pacific country Ecosystem Vitality Composant


Trends


Policy response needed to improve  Ecosystem Vitality

A closer examination of the Trend EPI for a subset of countries demonstrates distinct differences between Environmental Health and Ecosystem Vitality performances in the last ten years.

For the Environmental Health measure, most countries have improved their scores significantly since 2000. This is an indication of positive policy responses.

By contrast, for the Ecosystem Vitality measure, a majority of the countries doing poorly at present have been getting worse since 2000 which denote no political respond as far as EV is concerned.

Reduction of tropical forest clearing needed in Asia

The Yale Survey reports that 27 tropical countries accounted for 94% of global forest clearing and especially in the wake of the 2008 financial crisis.  But the economic 2008 downturn does not fully explain the decline in forest clearing. Instead, the data suggest that local and regional factors are more important when explaining deforestation dynamics.

Reductions in forest clearing have occurred in 12 countries (most significantly in Brazil, Paraguay, Bolivia, China) while increases have occurred in 14 including Myanmar, Peru, Malaysia and Venezuela.

But when aggregated together, decreases in the global share of forest clearing by large countries like Brazil have more than offset increases in countries such Malaysia and Indonesia and resulted in significant decline in tropical forest clearing worldwide.


Tuesday, October 23, 2012

Is Chinese cities' development ecologically sustainable?


Figure 1: Shanghai bustling Nanjing Road (REUTER)


On May 2012, the PRC government announced that 51.3% of the Chinese population now was living in urban areas. Even if this figure is somewhat questionable given migrant workers, now China is an urban-dominated society.

At the same time, the terms "harmonious society",  "resource-saving society" and "ecological civilization" are constantly employed at the highest levels of the Chinese government, highlighting its commitment to sustainable development.

But after the explosion of urbanization over the past 30 years, maybe it is now necessary to assess its dramatic effects on the environment and see whether this type of development is still sustainable and should be modified on the horizon 2030?


Ecological Footprint and Urbanization


Everywhere mass movement of people from farms and rural villages toward cities  has been the trademark of human development. Today around 75% of industrialized country’s population is living in towns and cities. During 2008, for the first time in history, the proportion of the world’s population who lived in urban areas reached 50%, symbolizing the beginning of a new urban era.


Even if China’s economical development expressed in GDP (PPP) is lagging behind European Union (EU) or North America (NA), its 2008 footprint as established by the WWF is the biggest while its land’s biocapacity is similar to EU and smaller than NA. As a result its ecological deficit in 2008 far exceeds its land’s biocapacity which defines the “human carrying” capacity of its habitat (see following Figure 2):


Figure 2: Footprints and biocapacities by selected countries as established in 2012 WWF's Living Planet report


How does a big city impact the footprint of a country?  If we consider Hong Kong ecological footprint we have an extremely narrow biocapacity base and a huge footprint: its ecological deficit is at least 200 times bigger than its biocapacity.

Big cities are similar to “entropic black holes” or nodes of energy and material consumption. They are absorbing food, energy, water and material inputs from far away hinterlands, their only outputs being waste or pollution (see Why cities cannot be sustainable and why they are key to sustainability? fromWilliam Rees and Mathis Wackernagel 1996).

In China the country's rate of urban versus total population increased from 17.4% in 1978 to 51.3% in 2012 over 33 years only, a scale unprecedented in human history. It is predicted that by 2030, the urbanization ratio will reach 65%, and that the population in various cities and towns will increase by 200 millions.

If we extend the Chinese footprint and biocapacity curve it means that around 2030 - all other issues being business as usual- China would have the same footprint than in 2008 NA and EU combined, with an ecological deficit more than 3 times its biocapacity.

Surely an entirely sustainable big city is pure utopia. No city or urban region can achieve sustainability on its own territory because the ecological hinterland necessary for supporting a high-density human settlement never coincides with its geographic location. But sustainable cities are an urgent issue given the enormous leverage they may have in the quest for global worldwide sustainability.  

The real issue is whether the spatial concentration pattern and high population of Chinese cities make them more or less sustainable than other type of settlement? Or whether it is necessary to control in the future the frenetic urbanization and cities’ development in China due to the enormous implications they may have on the ecological footprint of the country not to mention the planet?

China spatial distribution of cities and towns emphasizes its export-oriented development model


Unsuitable  regions for human habitation amount to 52% of China’s land. They are distributed westward from the “Tengchong (Yunnan) - Aihui  (Heilongjiang)” line (see following figure 3) with deserts, highlands etc.. Cities are mostly located eastward from this line in East coastal provinces. In the past “China proper” was a term used to express a distinction between the core and frontier regions. This core region where are located the biggest cities is associated with the Han Chinese, the majority ethnic group and with the extent of the Chinese language(s).

There are 34 province-level administrative divisions with 4 different organization types:
  •   24 Provinces strictly speaking (100,000 to 200,000km2),
  •   4 Municipalities: Shanghai, Beijing, Tianjin, Chongqing smaller (10,000 to 80,000km2) and densely populated,
  •  2 Special Administrative Regions outward oriented: Hong Kong and Macau much smaller (<1,000km2),
  •  4 Autonomous Regions vast and sparsely populated: Xianjian, Qinghai, Inner Mongolia and Tibet.

Figure 3: China's 6 central regions and 34 province-level administrations


Based on the 2010 census, if we look at the greatest cities (>100,000), we can identify 170 Prefecture or County-level cities which population is around  360 mil or 26% of Chinese population.


Among them there are 27 metropolitan areas which populations are greater than 3.5 mil , with a total population of 190 mil   (12% of China) (see figure 4). These leading metropolis are located in “China proper” and next to the coast. Their development in proximity to port facilities emphasizes the export-oriented development model implemented over the last 30 years.

In this east costal China there are three major economic cities' clusters which are:

  • Shanghai and the Yangtze River Delta with the fastest growth rate is one of the most populous regions in China; the delta has an area of 210,700 km2 (2.2% of China) and a permanent population of 148 mil (11.1% of China). 
  • Hong Kong and the Pearl River Delta is an important economic pilot region where the economic reform, the opening-up policy was introduced earlier; the “Greater Pearl River Delta" has a total of 181,000 km2 (1.9% of China) and a permanent population of 104 mil.
  • Beijing- Tianjin- Hebei area covers  216,000 km2 (2.25% of China) with a population of 100 mil; the so-called “Beijing-Tianjin Corridor” is the central area of the Bohai sea agglomeration and the political scientific and artistic center of China.


Figure 4: China's main metropolis >3.5 mil


Currently China has formed on its east cost a tight coastal ribbon with high economic development and huge concentration of population. From 2001 to 2008, the total GDP of these 11 coastal provinces had increased by an annual rate of 10% reaching 57% of the total national GDP.
The coastal population is currently 554 mil. Though China’s coastal area constitutes only 13% of its total landmass, more than 40% of the Chinese population now lives in this area. The region is responsible for 90% of China’s imports and exports.

The hidden side of cities’ development


Rural migrant workers


When viewing Chinese cities census it is uneasy to disentangle permanent from temporary residents. The hukou system household registration and control of migrant workers originating from ancient China was maintained by the Communist Party. The present partially reformed hukou system contributes to China's rural and urban disparity.

Rural migrants may spend only the Chinese new year in their family village but have to be accommodated in various urban areas most of the time! At the end of 2009, Tianjin municipality population was 12.3 mil, of which 9.8 mil were residential holders of Tianjin hukou (permanent registration) and 2.5mil (20.3%) were migrant workers.

Since 1978 Chinese rural-to-urban migration had been a dominant source of urbanization growth, the driving force being rural–urban income gap. Most rural migration takes place across provinces, from inland rural areas to coastal urban areas. In 2009, the total number of rural migrant workers was 230mil  (cf. UN State of China Cities 2010-2011).

Overloading of housing and social services, crime and congestion


Like many developing countries, unemployment and poverty problems have begun to emerge in China as a result of rapid urbanization, along with other problems such as overloading of housing and social services, increased crime, pollution and congestion.

After 2008 in the wake of the global financial crisis it seems to be the right time for adjusting industrial structure and redistributing migrant population. Due to the influence of the crisis, demands for laborers have declined, long-distance migration and convergence of population in coastal areas have abated. 


Now, the priority should be placed on strengthening the development of medium and small cities or towns. The employment and settlement of the eligible rural migrant population in cities and towns should be regarded as the main task in promoting urbanization.
         

         Land, sea and atmospheric pollutions


China is one of the most polluted countries in the world.  China State of the Environment Reports from 2009 to 2010  - each report being published yearly- show that the situation far from being under control is getting more and more severe. We shall relate these reports in a next post. Here are some illustrative items:

  • The ambient air quality : sulfur dioxide emissions are increasing by 20% on the last 5 years and around one third of the key cities are very dangerously polluted as regard WHO guidelines.
  • The proportion of cities with serious acid rain on annual average pH values of precipitation is 104 over 488 cities  (21.3%).
  •  Among rivers and lakes respectively around 18% of rivers and 35% of lakes are in very bad conditions and cannot be used for irrigation.
  •  Among the lakes used as reservoirs 11.5% are under heavy or intermediate eutrophication.
Moreover due to the excessive concentration  of the huge East costal ribbon conurbation the marine biocapacity of the Chinese offshore is being  depleted quickly: 

  •  China has lost 57% of its coastal wetlands, 73% of its mangroves, and 80% of its coral reefs since the 1950s; two thirds of the coastline is under threat from coastal erosion and reduction of marine biodiversity.
  • Polluted offshore waters are now covering approximately 147,000 km2, which accounts for over half of China’s total coastal marine areas, mainly concentrated in large estuaries and bays.

  • Since the 1990s, red or green tides or jellyfish blooms recurring environmental  disasters are very alarming signals on the overall health of marine ecosystems; a large-scale green tide occurred for the first time in 2007, and has reappeared every year thereafter.


Conclusions: Are Sustainable or Eco- Cities possible in China?


In China the huge urban rate expansion has led to a number of economic, social, urban and pollution issues. The conflict between economical or social development and the environment conservation has become increasingly obvious.

To answer the question at the beginning of this post: China cities’ development is far from being ecologically sustainable; the pollution hazards and the resulting health or economical issues are the biggest price paid to the frenetic urbanization increase during the last 30 years. 

The severe reality and potential problems entailed by existing huge cities’ footprints -around 70% of all country footprint- tell us that the sustainable management of cities is more important and urgent in China than anywhere else in the world. But this concerns more the reduction of each existing city’s footprint and the protection of hinterlands’ biocapacity by comprehensive regulations, plans and investments including public awareness actions.

There is a need to assess the process of mass urbanization on the east coast and its effects on the environment. Large urban areas are those that yield maximum leverage in terms of reduced costs for transport, roads, waste collection and wastewater treatment. But there are limits that are currently already met or widely exceeded regarding the use of scarce resources such as water or the destruction of natural environments such as marine biodiversity.

One of the main tasks should be to develop medium and small cities far from the crowded east costal ribbon in order to settle and stabilize the migrant population and have a more inward oriented development model.

There is only one example of eco-cities in China but is far from being conclusive, it is the project of the Dongtan Eco-city on an island at the mouth of the Yangtze River. The project was designed to accommodate 50,000 inhabitants by 2010 and presented at the United Nations World Urban Forum as an example of eco-city in a program of four such cities in China.The construction of Dongtan is now completly stopped and its media coverage has been negative due to delays and shortcomings in its execution. Critics have argued that Dongtan would have only anecdotical impact on  existing Chinese cities, which must in any case house the majority of the population.