Showing posts with label Water Pollution. Show all posts

Wednesday, February 27, 2013

China’s ocean and coastal areas sustainable development is a strategic issue constraining the further planned development of the country

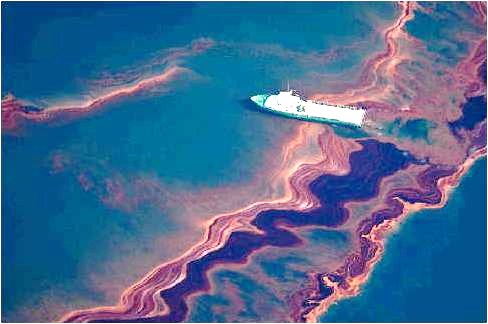
Figure 1 : More than 5,500 km2 of water in the Bohai Sea have been polluted by oil spilled at the CNOOC Penglai 19-3 oilfield since June 2011, causing the country's worst offshore maritime pollution See china.org


China’s marine jurisdiction includes temperate, subtropical and tropical areas crossing 38 degrees of latitude with 18,000 km of continental coastline.

China’s ocean and coastal environments offer countless habitats of biological and genetic diversity providing a wealth of ecosystem services such as fishery catches, nutrient recycling, detoxification and shoreline protection.

In East and Southeast Asia, the best performing countries for the length of their coastline in relation to their population are Japan and ASEAN, which are comprising  many islands and then, far behind, China and India which are large continental and populous countries.

Under these conditions, the conservation and enhancement of a relatively narrow maritime coastline for its huge population, is for China an important strategic issue.

Besides access to seaways, fisheries and mineral resources, the conservation of the biological productive capacity of sea and the impacts of global warming are considerable challenges for the well-being of the huge coastal Chinese population.


China’s oceanic and marine coastal organization- Adjacent coastal urban regions


The following Figures 2 and 3 show the coastline and the four Chinese adjacent sea locations: Bohai Sea (77,000km2), Yellow Sea (380,000 km2), East  China Sea (1,249,000 km2) and South China Sea (3,500,000 km2).

China’s coastline is more than 30,000 km long, on which 18,000 km of continental coastline and more than 12,000 km of island coastline. 

The bio capacity of sea is mostly located along the continental coastline due to the discharge of nutrient and other bio element brought by the main rivers.

Figure 2 shows the watershed of the 3 main rivers from South to North: Zhujiang (Pearl River), Changiang (Yangtze River) and Huanghe (Yellow River) and their discharge points into the South China, East China, Yellow and Bohai Seas.


Figure 2 : China’s coastline and their adjacent four seas


The following Figure 2 highlights the Bohai sea situation: the 3 main bays and the 6 river estuaries (Huanghe, Haihe, Luanhe, Dalinghe, Shuangtaizhe and Liaohe rivers). The Bohai Sea, the innermost gulf of the Yellow Sea, is one of the busiest seaways of the world and contains significant oil and gas reserves, providing much of China's offshore production. Bohai is a half-closed sea with comparatively low self-clean ability due to limited water exchange with the outside.

Figure 3 : Chinese Bohai Sea


As explained in my post dated 23 Oct. 2012, China has an urban coastal ribbon formed from 11 adjacent coastal highly developed regions, which have brought with them both population density and urbanization.

This urban coastal region accounts now for 60 % of Chinese GDP and 90% of its imports and exports and is seeing an increasing concentration of industrial activities. Though China’s coastal region constitutes only 13% of its total landmass, more than 525 bil people or 40% of the Chinese population live in this area. 

The Current Status of Chinese Coastal Environments is grim: the last 5 years have seen increased pollution pressure on coastal water marine environments


Land-based pollution is a key factor in the decline of conditions in China’s ocean and coasts. During the past 10 years, the volume of pollutants carried by river discharge has steadily increased.

The highest discharged pollutants are from agricultural sources (44%), domestic sources (37%), and industrial sources (19%). They include chemical oxygen demand, ammonia nitrogen, total nitrogen, total phosphorus, petroleum products, volatile phenols, and heavy metals. 

River monitoring results for the period 2002-2009, show that pollutants carried to the sea by the major rivers increased by 121.3% and reached up to 13.67 mil tons by 2009. The Changjiang (Yangtze) River and Zhujiang (Pearl) River contribute to about 70% of China’s total pollution runoff into the sea.

Pollution grade classification is defined in relation with the requirement of the various types of water ecosystems. China uses a five-grade classification scheme for marine water quality. Grade I & II are the best: grade I is required for sea fisheries, marine reserves or protected areas, grade II for aquaculture, sea bath, sport and marine entertainments. Grade III and IV are admitted respectively for general industrial coastal areas, port and marine development. The fifth grade is the worst: the water quality being less than grade IV. 

From Figure 4, 5 and 6 below, we see that water quality had dramatically decreased since 2005. In 2011, polluted offshore waters - classified Grade III, IV and worse- covered approximately 100,000km2, accounting for over half of China’s total coastal marine areas. These polluted water areas had increased by 50% during the last 6 years.  The best quality Grade I, covered only 45,000km2 and less than 25% of total with almost no Grade I water in Bohai Sea. Grade I and II areas had steadily dwindled since 2005.

Figure 4 : China marine coastal water quality in 2011


As seen in Figure 5 below, the polluted areas are mainly concentrated in large estuaries and bays, including in Bohai sea (Liaodong, Bohai  & Laizhou bays), Yellow sea (Jiaozhou Bay) , East China sea (Jiangsu coast, Yangtze Delta, Hangzhou Bay & Xiangshan Harbour) and South China sea (Pearl River Estuary). 


Figure 5 : 2011 China marine coastal water quality diagram distribution  

Limited waste treatment has placed great pressure on the marine environment. The above mentioned polluted areas are largely the most developed coastal areas within China, and the developmental strategy of “treatment after pollution” is one of the main reasons for the serious environmental problems.
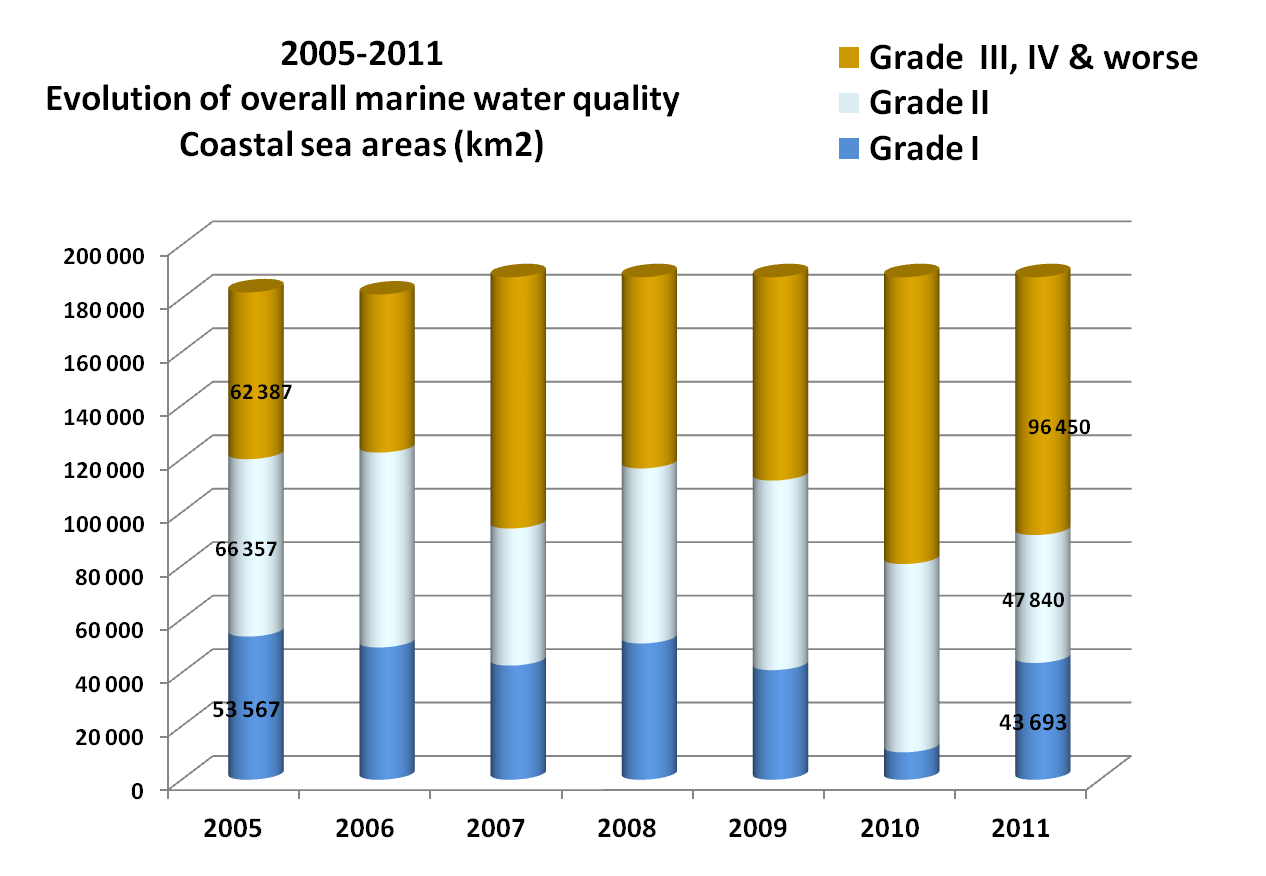
Figure 6 : Evolution of overall marine water quality 2005-2011


Damage to the health of marine ecosystems


Due to the rapid development of marine industries and the coastal economy during the past three decades, coastal ecosystems and their habitats have been under significant threat and have deteriorated.  Existing marine legislation remains much weaker than similar terrestrial environmental conservation legislation. 

Pollution, large-scale reclamation, and the invasion of exotic aquatic species have caused significant damage in coastal wetlands.

China has lost 57% of its coastal wetlands, 73% of its mangroves, and 80% of its coral reefs since the 1950's. Two-thirds of the coasts are under the threat of coastal erosion and the reduction of marine biological diversity.

A new study from Coral Reef Studies, James Cook University, and the South China Sea Institute of Oceanology, Chinese Academy of Sciences, published in the journal Conservation Biology describes the situation as a ‘wicked problem’ – meaning it has no easy solutions.

The corals of the South China Sea region cover an area of 30,000 km2, have high conservation values, and support the livelihoods of tens of thousands of fishers. The fact that some reefs are claimed by several different countries makes conservation and management particularly difficult.

“Typically, when a coral reef degrades it is taken over by seaweeds – and from there, experience has shown, it is very hard to return it to its natural coral cover. The window of opportunity to recover the reefs of the South China Sea is closing rapidly, given the state of degradation revealed in this study”.

“We found that coral abundance has declined by at least 80% over the past 30 years on coastal fringing reefs along the Chinese mainland and adjoining Hainan Island. 

On offshore atolls and archipelagos claimed by 6 countries in the South China Sea, coral cover has declined from an average of >60% to around 20% within the past 10–15 years,” it says.

Increasing prevalence of marine hazards


Since the 1990s, ecological disasters caused by harmful algae blooms (HAB) and jellyfish blooms have been frequently recorded in China’s seas causing direct economic losses of nearly 2 bil yuan.

The frequency and scale of red tides significantly increased since the late 1990's. On 2007-2011: the registered yearly average is 65 red tides reaching an accumulated area of 11,000 km2 each year.

A large-scale green tide occurred for the first time in 2007, and has reappeared every year thereafter. During 2009-2011 in China’s Yellow Sea the distribution area was 26,000- 58,000 km2 with and actual coverage of 500- 2,100 km2.

Since 2000, the biomass of giant jellyfish has been increasing and since these ingest large amounts of zooplankton, they rob fish of their food supply.


From 4 June to 12 July 2011, three undersea oilspills of long duration occurred in CNOOC Penglai 19-3 oilfield resulting in a large discharge of crude oil and oil-based mud causing serious pollution to the Bohai Sea ecological environment.  Plankton species and marine life were damaged by petroleum content in Tangshan in Hebei Province, Qinhuangdao port in Shandong peninsula, and Liaoning Province. The oilspills contaminated first class sea water quality of about 6,200km2.

The oil spill was not publicly reported until 31 days later on July 5, 2011, and was only revealed because of a public microblog tip-off. Further criticism followed that the spilled oil flow into the Yellow Sea may damage both North Korea and South Korea; media from those countries  have complained about Beijing being as irresponsible as the Japanese's reluctant to share information about its nuclear disasters.

Decline of inshore marine fishery resources


Historically under-utilized, China’s inshore marine fishery resources are now being over-exploited. Since the 1960’s, the number of fishing vessels has steadily increased, and fishing technologies have modernized and grown ever more efficient.

In the mid-1970's, fishery catches reached three mil ton. The harvest of traditional targeted species such as large and small yellow croaker dramatically decreased, while catches of lower quality fish species increased. Through the mid-1980's, catches rose an average of 20% each year, and the main targeted species shifted to small sized pelagic fishes such as anchovies, mackerels, and squids which eventually constituted more than 60% of the total catch.

The accelerating harvest, a lack of systematic fisheries management combined with a loss of fishery habitats, the destruction of nursery and breeding grounds have created a decline in the offshore fishery resources evident today.

* *
*

Due to the current situation of marine environment, are further increases of urban coastal areas still possible?


Marine space is one of the main elements supporting sustainable economic development in the future, and therefore ecosystem functions must be considered when analyzing the capacity of marine spatial resources to accommodate future development needs.

According to China’s planned development, by 2020 -2030, the coastal areas’ population will grow from 524 mil now, to 700 mil and then 840 mil people, which is more than a 50% increase.

Industrialization of these coastal areas will require increased pressures on marine spatial resources. Harbors’ shoreline may increase from 600 km to more than 1,000 km. Coastal industries and urban development may require sea reclamation of more than 5,000 km2. Port construction, ship building and marine tourism industries will all need to expand their marine space. Modernized fisheries industries will need to develop seaward towards deeper waters.

But after this review, it appears clearly that the continued increase as envisaged for the development of China's coastal areas should be discussed again. Damages and threats of pollution already registered in coastal zones and marine ecosystems should lead to modify the organization and pace of the planned development.

The China's people awareness on the environment, food and health  issues, as evident from the accounts published on the country social network, is another reason to prefer a more quality oriented model of development for the coming years. 

In addition, we must not lose sight that far beyond China, the protection of marine ecosystems and resources is indeed a shared responsibility with Japan and ASEAN countries such as Vietnam, Malaysia and the Philippines all sharing with China the same seas.



Monday, January 21, 2013

Mother India’s dwindling Biocapacity puts its development at risk


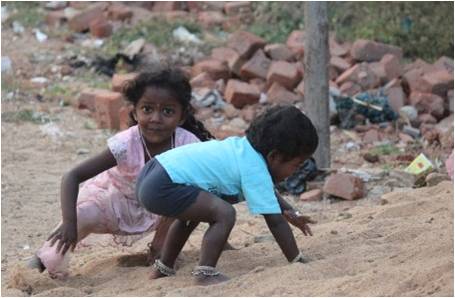
Figure 1 : At the beach in Chennai Indian kids playing among waste


As in all countries the main drivers of Mother India’s biocapacity are its climate, land area, and population size. India is over a land area about one third smaller than China with a population about the same size. As a result Indian biocapacity is less than 50% of Chinese one. Australia’s land area is roughly twice as big as India, but with a much smaller population: its biocapacity is half that of India.  Biocapacity is the ecological wealth of nations.


Why biocapacity matters for current economic boom?


Figure 2 : Main Asian Pacific countries with middle income per capita


We know that every country needs food, timber, waste treatment and other bio-services to meet the final demand of its citizens. This is called the “ecological footprint” of the country and measured by the area of cultivated land, forestry or fishing grounds required to produce the bio-services.

On the other hand, each country has within its borders farmland, forest, wetland or fishing grounds which are able to supply bio-services meeting all or part of its footprint: this is called the “biocapacity “of the country.


Figure 3: Main countries’ biocapacity from the last WWF Living Planet Report


Footprint and biocapacity respectively characterize the demand and the supply side of each country bio-services' exchange. Both are expressed in global hectares (gha) at the country level as in Figure 3 above, or in global hectare per person as in Figure 4 below. 

The excess of country’s demand footprint over its supplied biocapacity is procured by other countries’ biocapacity and is an ecological debt. When the overall demand is greater than the Planet biocapacity then we may have modification and disruption of climate conditions.


Figure 4 : Unit Footprint and Biocapacity from main Asian middle income countries from the last WWF Living Planet Report 


In 2008 the ecological debt expressed in % of biocapacity over main Asian middle income countries was distributed as follows : Mongolia -64% (excess); Indonesia -14% (excess) ; Malaysia 56%; Philippines 60%; India 81%; Thailand 105%; China 145% and Sri Lanka 157%. India in 2006-2008 had improved its debt which was around 100% in the previous years. China and India the heavy weights of the Asian Pacific region are highly indebted.


Yale University has published its 2012 ranking of EPI Environment and Pollution Index, across 132 worldwide countries. India is ranked according to the index of pollution & environment (EPI) as the worst performing countries in Asia Pacific just after China (see my post dated 6 Nov 2012). 


All travelers in India are struck by waste eyesores littering streets, roads and beaches (see Figure 1). It was only in 2000 that Indian authorities decided to exercise their power under the Environment Protection Act of 1986.  Almira Patel in Bangalore introduced an action into the Supreme Court when she noticed that frogs stopped singing, on her lovely village road outside Bangalore. They were all dead because the city was dumping its garbage in water lakes and wetlands. After an investigation by the Supreme Court it was only in 2005 that the Indian Government provided funds to tackle the problem of solid waste collection.


The groundwater quality is very poor and only 33% of households have a toilet. Jairam Ranesh Minister of Rural Development said in The Telegraph that "Nearly 60 % of the people in the world who defecate in the open belong to India. Even countries like Bangladesh, Nepal, Pakistan and Afghanistan have better records." Now his department is emplementing the Nirmal Bharat Abhiyan Program (NBA) to achieve complete sanitation with a budget of 3500 bil INR on 2012-2013. 


The following curves (see figure 5) established by the Confederation of Indian Industries (CII) and Global Footprint Network are showing that Mother India is depleting its ecological assets in supporting the current economic boom – a doubling of GDP per capita since 2000- and the growth of its population.  


Figure 5 : Indian footprints are biocapacity over 1961-2003 from Confederation of Indian Industries CII and Global Footprint Network India’s Ecological footprint report  


Rapid population growth over 1961-2003 has been done with Indian unit footprints more or less stable but with a huge dwindling biocapacity dropping around 46%. This means that more and more people are sharing a limited amount of biocapaity.

Pressure from croplands are depleting forests’ biodiversity


The majority of India’s biocapacity is cropland. Other land types, such as forest and grazing land, while used by humans also serve as the habitat for a variety of endangered species, such as the Bengal tiger.

As the need to feed more people grows, pressure will increase to convert forest to cropland. 

This competition for biocapacity could be devastating to the remaining forest species and biodiversity.

There is already an extremely low forest cover ratio at 23% of land area and India is pondering an increase up to 33% but chances are very low because most enforcements are done at regional or local level.

In addition to loss of habitat for wild species, conversion will also reduce the capacity of forests to provide ecological services such as carbon sequestration, freshwater collection, and erosion control in mountainous regions.

Indian Ecological Debt


India’s Human Development Index score increased from 0.4 to 0.6 over the past 30 years - 0.8 being the threshold of high development- but a growing ecological debt and a bad water use management put this improvement at risk. 

People living at lower-income levels are likely to be more affected by the growing ecological debt than those at higher income levels. While wealthier individuals are more likely to have sufficient income to purchase imported food and goods to meet their needs, poorer communities often depend more directly on local biocapacity, and thus are more impacted by the health and productivity of these ecosystems.


Figure 6 : India’s Ecological debt on the Planet biocapacity from CII and Global Footprint Network India’s Ecological footprint report  


The ecological debt situation has improved somewhat in 2003 -2008 with a slight reduction from 100% to 85-90%, but will this trend prove to be stable?

Climate change is an example of ecological debt on a global scale that affects India directly. 

Already, warming temperatures are causing glaciers to melt in the Himalayas, altering the flow rates of many of India’s most important rivers, causing increased landslides and flooding such as that which displaced one million people in the northern state of Bihar in 2008.

In addition, global warming can produce shifts in the growing seasons for major crops such as rice, which production could fall by as much as 40%. The Indira Gandhi Institute of Development Research has projected that future climate-related factors could cause India’s GDP to decline by up to 9%.

Water conservation is a driver for Indian Biocapacity


India is blessed with the Himalayan range proximity including over a hundred mountains exceeding 7200 meters across five countries: Bhutan, India, Nepal, China, and Pakistan, the first three countries having sovereignty over most of the range. 

Three of the world's major rivers, the Indus, the Ganges, and the Brahmaputra all rising near Mount Kailash in Tibet China, are crossing and encircling the Himalayas.

As a result India has the largest total Water output of any country in the world, adding up to 987 bil m3/year. Yet, its water use per capita is only around 900 m3 per person less than many countries with similar or higher per capita income (Indonesia 1400 , Thailand 2300 but China 700).

The nation’s cropland output and efficient use of water  are lagging far behind technical potential. Forty years after the Green revolution, many experts argue that India’s population is growing faster than its ability to produce staples such as wheat and rice. Indian Government has not expanded irrigation or agricultural research since the 1980s and groundwater has been depleted at alarming rates in Punjab for example.

All these are due to bad water conservation, reduction of soil quality and biodiversity, decline of groundwater level in critical region. An Integrated Watershed Development Program (IWDP) to restore water balance, soil and cover is being implemented  by the Ministry of Rural Development with a budget of 2744 bil INR in 2012-2013. This is part of a overall action plan for Greening Rural Development in India.   

Will India have sufficient economic reserves to compete for the biocapacity needed to support its population in the future? The costs to the Indian economy may grow when the laws of supply and demand put a higher value on the biocapacity available in nations that have an ecological reserve.

South North Water Transfer Project (SNWTP) in China is an example of the resulting growing competition  between nations for controlling available biocapacity (see my post dated 12 Nov 2012).

China is lagging with 700 m3 of water per person after Indian because of Chinese water shortage. Large-scale water transfers have long been discussed by Chinese authorities as a solution to the country's water shortage as the South-North Water Transfer Project.

In a book titled "Tibet's Waters Will Save China" a group of Chinese ex-officials have championed the northward rerouting of the waters of the Brahmaputra as an important lifeline for China in a future phase of South-North Water Transfer Project. Such a diversion will fuel tension with India and Bangladesh if no prior agreement is reached on sharing the Tibet's water.

Wednesday, November 21, 2012

Fresh water environment in China: an overall grim situation with apparent slight amelioration on lakes from a poorly documented report

Figure 1 : Siberian and White-naped Cranes near Poyang Lake from birding2asia.com

Main information discussed in this Post are issued from the 2011 State of the Environment Report (SOE) published on 25th of May 2012 by the Ministry of Environmental Protection. The 2011 SOE is less detailed as the previous 2009 & 2010  issues and is not published in English. This makes comparisons more arduous.
Water resource has always been a problem in China particularly in the region north from the Yangtze River where only 19.1% of  resource from rain is falling. In the past 50 years, water overexploitation has almost dried up the Yellow River's valley. In 1997, the lower Yellow River did not flow during 230 days. Increased erosion and sedimentation, especially on the Loess Plateau, have made the river much less navigable.

Figure 2 : China main rivers 
Continuous emissions from manufacturing industries and industrial spill hazards are the largest contributor to lowered drinking water quality across the People’s Republic; introduction of poorly treated sewage and extensive use of agricultural fertilizers and pesticides have proven to be major contributors as well.
These water quality issues coupled with seasonal scarcity of water may spark endemic water shortages, which frequently affect millions of people.

Main river systems

China uses a six-grade classification scheme for water quality. Grade I & II are the best. Water no worse than grade III can be used for drinking, although sometimes treatment is required. Grade V can be used for irrigation. Water less than grade V cannot be used for irrigation. Nevertheless according to criteria used by the UN Environment Program, both grade V and less than V are unfit for drinking, aquaculture, industrial use and even agriculture.

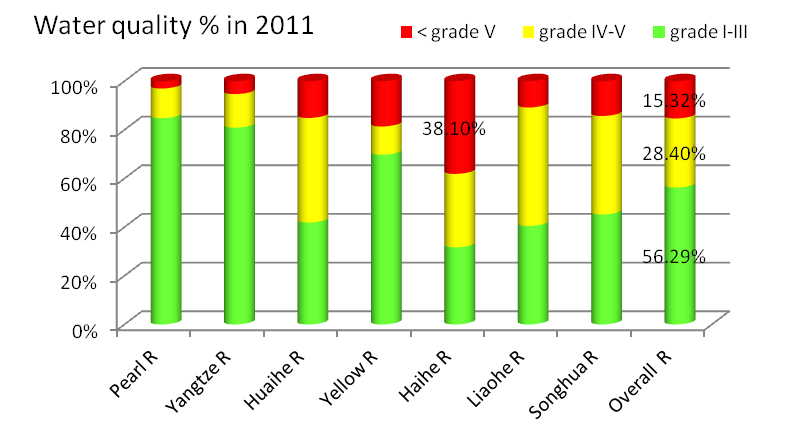
The 2011 State of the Environment Report (SOE) underlines that the quality of specific rivers systems is deteriorating from South to North as follows (see Figure 3):
  • The Pearl River and the Yangtze River systems have "good water quality";
  • The Huaihe River, and the Yellow River systems have “ poor water quality";
  • Both the Haihe River flowing through Beijing and Tianjin and the Liaohe River systems are "badly polluted".
  • The Songhua River is "moderately polluted".
In order to appreciate variation from the previous 2 years we have dismissed additional river systems   (Zhejiang and Fujia, Southwest and Inland river systems). Figures 3 & 4 concentrate on the major systems which were already in the 2009-2010 review.
Figure 3 : Quality grading of the seven major river systems in 2011
The Yellow River Conservancy Committee, which surveyed more than 8,384 miles of the river in 2007, said 33.8% of the river system registered worse than grade V. The report said waste and sewage discharged into the system totaled 4.29 bil tons. Industry and manufacturing provided 70% of the discharge into the river, with households accounting for 23% and just over 6% coming from other sources.
The 2005 Jilin chemical plant explosions in Jilin City caused a large discharge of nitrobenzene into the Songhua River and the entire water supply to Harbin city  was cut off for five days though it was only after 3 days that officials admitted that a severe pollution incident was the reason for the cutoff.

Figure 4 : Variation of major river system water overall quality from 2009 to 2011


As it can be seen on Figure 4, for all major river systems across around 400 river sections under national monitoring, overall river quality does not really improve over the last 3 years. 

It should be noted that grade V is not documented in the current SOE report and was around 25% of Grade IV-V in 2009-2010 and even more for the Yellow River. 

As a result  we can presume under UN Environment criteria that grade V or less unfit even for agriculture and industrial use which registered  around 33% in 2007 are still currently around 22-24% which is a very grim water quality.

Lakes and fresh water reservoirs

Among the 26 key lakes and reservoirs under national monitoring program, quality ranged as shown in Figure 5. Apparently the quality has improved from the previous 2009-2010 years with a two fold increase of grade I-III.  But it should be noted that no detailed documentation was provided in 2011 on each lake or reservoir quality as it was the case in the previous two years. This lack of detailed information- as data are improving much- is extremely worrying.

The main pollution indicators were total phosphorus, and chemical oxygen demand (total Nitrogen does not participate in water quality evaluation).
Figure 5 : Overall quality grading of major lakes and reservoirs 2009-2010-2011


Addition of nutrients such as nitrogen and phosphorus through fertilizer or sewage discharges are the determinant of the eutrophic state of a reservoir. The increase of nutrients causes the proliferation of plants and living organisms such as algae or phytoplankton

Lakes are usually classified as being in one of three possible classes: 
  • oligotrophic  (little or no aquatic vegetation) , 
  • mesotrophic (commonly clear water)
  • eutrophic (large quantities of organisms, including algal blooms)  

Figure 6:  Trophic state index (TSI) of major lakes and reservoirs in 2011

Among the 26 lakes and reservoirs (see TSI in Figures 6 & 7) a majority of lakes or reservoirs are under eutrophic state: 8-11% under heavy (HE) or intermediate (IE) and 42-46% under slight (SE) eutrophic state. Only 46% are posting mesotrophic (ME) level in 2010-2011 in reduction from 2009.  Currently only a minority of lake have clear water with little or no aquatic vegetation.


Figure 7 : Overall TSI of major lakes and reservoirs 2009-2011


Compared during the previous years the TSI shows a variation among the monitored water bodies:
  • Reduction of eutrophic state: Dianchi Lake improved from heawy  to intermediate,  Donghu  Lake from Intermediate to slight  eutrophication. 
  • Raising of state: from slight to intermediate both Yuqiao  and Songhua reservoirs.
There have been a high number of river pollution incidents in recent years in China, such as drinking water source pollution by algae in the Taihu Lake  in May 2007. It was reported that a "bloom of blue-green algae that gave off a rotten smell" shutting off the main water supply to 5.8 mil people. By October 2007 the Chinese government told it had ordered 1,300 factories around the lake to shut down. However, Wu Lihong, one of the leading environmentalists alleged in 2010 that not a single factory was closed. Jiangsu province planned to clean up the lake and chaired by Wen Jiabao the State Council set a target to clean Taihu lake  by 2012.  However, in 2010 The Economist reported that a fresh pollution outbreak had occurred, and that Wu, released from prison in April, was claiming that the government was trying to suppress news of it, all the while switching to other supplies in place of lake water.

Ground water quality in Cities

Ground water as opposed to surface water (river and lakes) is located beneath the earth in aquifer. Ground water in cities is more affected by pollution than China’s rivers and lakes.

In 2010-2011, 182-200 cities across the country had been carrying out a ground water quality monitoring on a total of 4100-4700 points. The drink water classification is organized with the following 5 levels: excellent, good, almost good (to a better level…), poor, very poor. 

National groundwater quality situation is stable at a very alarming level with a majority of monitored points which have poor or very poor levels: together 57% on 2010 and 55% on 2011.  
Water quality is excellent - good – almost good (to be better…) only for 43% in 2010 and 45% in 2011. The odd level almost good (to be better…) is around 5% on both years.

Deteriorated water quality in the city are mainly concentrated in the north, northeast and northwest regions.

Figure 8 : Quality level of underground water in Chinese cities


Chinese environmental activist and journalist Ma Jun warned in 2006 "In the north, due to the drying up of the surface water, the underground water has been over-extracted. The water shortage in the north could have drastic affects because almost half of China’s population lives on only 15 percent of its water. The situation is not sustainable. Though the south has abundant water, there is a lack of clean water due to serious water pollution. Even water-abundant deltas like the Yangtze and the Pearl River suffer from water shortage”.
According to an article in the Guardian, in 2005, Pan Yue, deputy director of the state environment protection agency, warned that economic growth was unsustainable due to the water problems. In 2004 the World Bank warned that the scarcity of the resource would lead to "a fight between rural interests, urban interests and industrial interests on who gets water in China."


Water conservation and transfer projects


Three Gorge 22,500MW power dam, by reducing coal consumption, increasing Yangtze's barge capacity avoids tons of Green house gas. An important function of the dam is also to control flooding major problem of Yangtze River and thus increase the water available during the dry season. The reservoir's flood storage capacity is 22 km3 which is almost 50% of all major and key lakes discussed above. 

But the mere size of the reservoir -660 km length x1.12 km width- implies a huge ecological and human cost:  

  • The land in the area is experiencing erosion, absence of silt downstream will cause riverbanks to become more vulnerable to flooding including Wuhan, Nanjing & Shanghai more than 1,600 km away. 
  • Much of this Yangtze sediment is now settling in the dam instead of flowing downstream; less benthic sediment downstream will cause biological damage and reduce aquatic biodiversity.
  • The region is home to 6,388 species of plants of which 57% are endangered. Around  361 different fish species are living in the Yangtze River basin accounting for 27% of all endangered freshwater fish species in China. The dam contributed to functional extinction of the Baiji Yangtze river dolphin. From the 3,000 to 4,000 remaining critically endangered Siberian Cranes, a large number currently spend the winter in wetlands destroyed by the Three Gorges Dam. As of June 2008, China relocated 1.24 mil residents about 1.5% of the province and Chongqing Municipality population on which about 140,000 were relocated to other provinces. The 600km long reservoir flooded some 1,300 archaeological sites and altered the appearance of the Three Gorges as the water level rose over 91 m; heritage relics are being moved to higher ground as they are uncovered, but the flooding inevitably covered undiscovered relics. Some sites could not be moved because of their location, size, or design.


As concerns the ecological cost only, the question is whether the reduction of footprint (less CO2 released and more fresh water available) resulting from Three Gorge Dam are greater than the cost in biocapacity reduction resulting  from endangered wetlands, biological damage, plant and animal wildlife extinction. The only fact that the cost of the loss of ecological capital that can never be replaced is beyong assessment provides some clue.


South North Water Transfer Project (SNWTP): Large-scale water transfers have long been discussed by Chinese authorities as a solution to the country's water shortage. The South-North Water Transfer Project- the Eastern Route or Grand Canal revamping-  is being developed primarily to divert water from the Yangtze River into the Yellow River and Beijing.
The development or diversion of major rivers originating from China but flowing mostly across Chinese boundaries, such as the Brahmaputra River and the Mekong River, could be a source of tension with Vietnam South North Water Transfer Project and Thailand. In a book titled "Tibet's Waters Will Save China" a group of Chinese ex-officials have championed the northward rerouting of the waters of the Brahmaputra as an important lifeline for China in a future phase of South-North Water Transfer Project. Such a diversion could fuel tension with India and Bangladesh, if no prior agreement would be reached on sharing the river's water.