Thursday, September 13, 2012

Sumatra open fires exacerbated by Global Warming choke Malaysia and Singapore while destroying Indonesian rain forest and biodiversity


Figure 1 June 29th, 2012 numerous illegally lit fires continue
to rage in Sumatra Tripa peat swamp forests near Aceh

During June to Sept 2012 air pollution due to increased Sumatra open burning and a very dry season has triggered bad air conditions and health warning on Malaysian peninsula and Singapore Island.Such strong periodic haze events had already been observed in the past years in relation to El Niño/La Niña-Southern Oscillation due to Global Warming. The worst haze to hit the region took place in 1997. In 2006, it was so bad that Malaysia was forced to close Port Klang and declare a state of emergency in Klang and Kuala Selangor.Many people think that air pollution in Asia-Pacific is a transient phenomenon that will gradually disappear as had happened in London during the nineteenth century. We believe, however, that the exacerbation of this phenomenon in Asia-Pacific due to global warming, the cross-border aspects and high population densities are disturbing and aggravating factors that did not exist in the past centuries making this problem more difficult to solve.


Figure 2: Smoke blows from forest fires on the Indonesian island of Sumatra, as shown
in this image taken by NASA's Terra satellite on June 14, 2012 at 03:45 UTC
Hotspots detected are indicated in red. Sumatra is currently in itsdry season, which occurs between May and September


Sumatra open fires


Though open burning is illegal in Indonesia, fire is widely used by plantation managers and farmers to clear land for new plantings. Fires often spread into adjacent forests and peat lands, where they can burn uncontrolled until rains arrive. Although typically too wet to combust, carbon-rich peat land forests acquire enhanced deforestation and degradation susceptibility to human ignited fire during droughts.
In the case of the open fires in the Sumatra Tripa peat swamp forests near Aceh (see figure 1) environmental groups have warned that the local endangered Orangutans were”doomed” unless the fires was stopped. They say the fires were lit by palm oil companies and threaten about 200 orangutans in the area – one of the densest populations in the world.
Indonesian President Yudhoyono has won global plaudits for saying ”deforestation is a thing of the past” and that ”losing our tropical rainforests would constitute the ultimate national, global and planetary disaster”.
But that has not stopped the annual ”burning season” of forests in Borneo and Sumatra as companies take advantage of dry weather to prepare the ground for new plantations.
Indonesia’s government has outlawed land-clearing by fire but weak law enforcement means the ban is largely ignored.
The ASEAN Specialized Meteorological Centre (ASMC) was established in January 1993 as a regional collaboration program among the National Meteorological Services of ASEAN member countries.
The Centre is hosted by the Meteorological Service Singapore, National Environment Agency of Singapore using satellite pictures to monitor hot spot count for Sumatra, Borneo and others ASEAN member fire prone areas since 2006 (see figure 4).
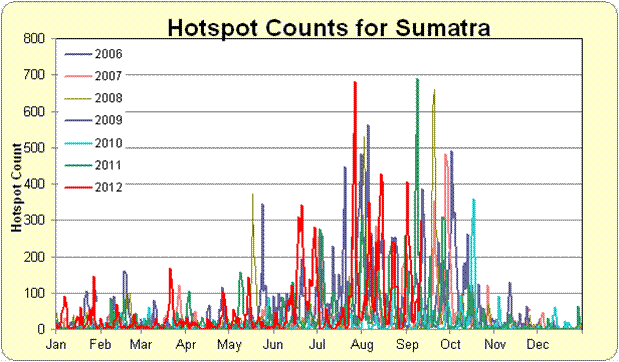
Figure 3 : This figure from ASMC shows high level 300-700 June-July 2012 hot spot counts over Sumatra


This open burning phenomenon is not located only in Indonesian Sumatra. Open burning of agricultural lands and forests in Indonesian Kalimantan southern Borneo are creating thick smoke that reach northward Malaysian Sarawak and Sabah. Myanmar also a huge Hot Spot Count this year during Feb-May dry season.  All ASEAN countries are concerned as shown in the table below.

Table 1: Asean Hot Spot count monthly


Haze in West Malaysia and Singapore


The haze season usually occurs each year from June to September, which is the dry season in West Indonesia and Malaysia and also a time when farmers prepare their land using the slash-and-burn method.

Figure 4 : Singapore 11 Sep 2012


Since 2009 the air quality status is being monitored by the Malaysian DOE (see http://www.doe.gov.my/apims/) using a network of around fifty Air Pollutant Index (API) metering sites covering all Malaysia. .
In 2012 the Malaysian haze situation during the dry season had heavily worsened especially in areas such as Kuala-Lumpur, Selangor Klang Valley, Pulau and Pulau Penang . 


Figure 5 : 2012 cumulated API status in Selangor


During June to Sept 2012, visibility has been poor, the sky gloomy and blanketed by fumes during long period: in the Klang Valley it is more than 60% of time or 5 months this year. Haze builds up during the dry season, has been affecting tourism, preventing outdoor activities and contributing to health problems across the region.

The API  reached 127 in Kuala Lumpur, 144 in Port Klang and 129 in the township of Shah Alam. Readings considered unhealthy (API index >100) has been observed during 2-6 days depending of sites. Most health issues are respiratory problems including asthma in relation with high concentration of very small particle (<2.5µm or PM2.5) entering the lungs. These particle are small enough for them to force their way into the very part of the lungs where oxygen is absorbed.

On Penang island a person in my family had a health problem during this period. Our doctor told us that there were many people affected by respiratory diseases and even if the API could  be considerated as moderate there was a cumulative effect of very small ash particles on lungs after long period of haze inhalation.

On 7 Sept Singapore saw its worst air pollution reading of the year as the island was shrouded in haze from Indonesian forest fires. Air pollution from Indonesian forest fires has become a recurring problem in the region, especially during this time of year.  Singapore expressed concern that haze could  affect the Formula 1 Grand Prix scheduled on 21-23 Sept 2012.

Global warming in Southeast Asia- El Niño/La Niña-Southern Oscillation (ENSO)


Southeast Asia region shows large inter annual variability in fire activity owing to coupling between El Niño induced droughts and anthropogenic land-use change. During the warm phase of ENSO Pacific Ocean and the Indian Ocean Dipole, cool sea surface temperature anomalies near Indonesia decrease regional rainfall. These events occur across the tropical Pacific Ocean roughly every five years and have shown during the last decades an increase of El Niño (warm current) and a decreased of La Niña (cool current). 
Historical data studies show that the recent El Niño strengthening is most likely linked to global warming. Even after subtracting the positive influence of decadal variation present in the ENSO trend, the amplitude of the ENSO variability in the observed data still increases, by as much as 60% in the last 50 years.


There is a potential for the number of fire spots to rise and haze conditions to worsen if there is no rain. In dry years, like those of the 1982-83 and 1997-1998 El Niño events, land burning can last for months, releasing vast stores of carbon dioxide into the atmosphere. Emissions from fires in those years amounted to more than 10 percent of global pollution.
In the Global Fire Emissions Database version 3 (GFED3), regional fire emissions were as high as 1,069 Tg C during the 1997 El Niño but only 21 Tg C during the 2000 La Niña, illustrating the sensitiveness to Global Warning.


Recent finding on haze health hazard from land fire emission in Southeast Asia


Globally, most fires occur in Africa and South America, but recent studies have highlighted the importance of Southeast Asia because of high population densities near high fire activity.

According to a new study in Nature Climate Change, clearing forests and other vegetation with fire in SE Asia increases region population mortality. The research found that fire-induced air pollution, including fine particulates and a rise in ozone, could be linked to thousands of deaths during El Nino years when dry conditions worsen human-set fires. The pollution was found to be worst over Malaysia, Singapore and Indonesia where the vast majority of the fires are set. 

This study published in Nature Climate Change on 12 August 2012 shows that during strong El Niño years land fires contribute up to 200 μg/m3 in annual average fine particulate index (PM2.5) and up to  50 ppb in ozone surface concentrations near fire sources. This corresponds to a fire contribution of 200 additional days per year that exceed the World Health Organization 50 μg/m3 /24-hr  (PM2.5) interim target and an estimated 10,800 person annual increase in regional adult cardiovascular mortality.

These findings indicate that reducing regional deforestation and degradation fires would improve public health along with widely established benefits from reducing carbon emissions, preserving biodiversity and maintaining ecosystem quality.


Haze periodic problem highlights a weak ASEAN cooperation


ASEAN's efforts to tackle the periodic land fires and haze problem in the region saw nine of its ten members sign the “2002 Asean Treaty on Transboundary Haze Pollution”.  But only Indonesia who is the principal culprit has yet to ratify this accord. Moreover, the bloc has yet to draw up an implementing mechanism for the treaty.

Some results have been attained as described above on the monitoring of hot spot and haze pollution metering. But stronger collective action is necessary in Sumatra at ground level to prevent forest fires, combat them collectively and increase law enforcement actions. These land fires are caused deliberately or by negligence. Moreover there are special circumstances that need to be specifically tackled with such as peat land management or biodiversity protection.

Environmentalists say “ASEAN has been talking for more than 10 years on how to combat forest fires and haze, but more concrete action needs to be done.”
ASEAN has been boasting a Regional Haze Action Plan and a Panel Experts on Fire and Haze Assessment and Coordination. Yet the fires recur every year stronger and the haze continues to afflict Indonesia’s neighbors with varying degrees of seriousness


Saturday, July 21, 2012

RIO +20: The gradual establishment of a “green economy” through what should be a second Asia Pacific industrial revolution is a key priority


RIO+20 summit showed that developing countries in South Asia were very cautious on the Green economy model


Some developing countries, particularly in South Asia, are fearful that environmental and economic issues are to take precedence over social, poverty and equity issues. They ask that developed countries refrain from practicing protectionism under the pretext of pursuing a green economy agenda. 
They fear that a few powerful countries write the rules of global trade, finance, and environmental action harming the environment and people in the South. They think that further privatization, commoditization and financialization of nature and its ecosystem functions, could  lead to further concentration of control, land-grabs, bio-piracy, displacement and marginalization of communities most dependent on access to these resources, and loss of cultural identities."The southern voices are getting marginalized," Mohan Munasinghe, chairman of the Sri Lanka-based think-tank, Munasinghe Institute for Development, told the NGO SciDev.Net. But our world today is locked in social, political, economic, and environmental crises as the huge increase of food and commodity prices due to extraction pressure put on the environment showed prior the 2008 crisis.


Are China environmental commitments as expressed during the RIO+20 summit really serious?


China had boasted its solemn commitments to its own people and the international community at large:

  • In the past six years, China’s energy consumption per unit of GDP was cut down by 21%, equivalent to 1.6 billion tons of CO2, and the total discharge of main pollutants dropped by around 15%
  • Reforestation has increased its forest by 620,000 square kilometers, which was the largest increase in the world.
  • In future China will strive to meet the obligatory targets set for the year 2015, namely:
    • To lower CO2 emissions and energy consumption per unit of GDP by 17% and 16% respectively,
    • To raise the proportion of non-fossil fuels to 11.4%
    •  To cut total discharge of main pollutants by 8% to 10% all from the 2010 levels.

But are these achievements really true?  Five researchers have compared figures released between 1997 and 2010 by the Beijing National Statistics Bureau of the 30 provinces emission inventories (see Figure 1).


Figure 1


No real surprise, the numbers do not match. Published in Nature Climate Change (NCC), the results of the analysis show a difference of 1.4 billion tons of CO2 by 2010. The figure is equivalent to Japan’s annual CO2 emissions, the world’s fourth largest emitter, with 5% of the global total! The Middle Kingdom count of carbon is wrong by 18%. We understand better under these circumstances, the reluctance of Beijing to see progress in negotiations on international control of releases of greenhouse gases.

Chinese authorities claim, in fact, that national emissions rose by just over 7% per year between 1997 and 2010. In reality, says NCC, that growth rate would be closer to 9% per annum.


Figure 2


In 2011 China (see Figure 2) is the biggest CO2 emitter in the world around 9.7 billion tons CO2 more than US (5.42 billion tons) and EU (3.79 billion tons) together (From PBL 2012 Report- Trends in Global CO2 Emissions).


Figure 3


Among the biggest head count CO2 emitters (see Figure 3) are US: (17.3 ton CO2 per capita), Saudi Arabia (16.5 ton CO2) and Canada (16.2 ton CO2) but Asian Pacific countries are now the fastest growing source of Carbon emissions. Among the top 10 head count CO2 emitters in 2011 there are now four Asian Pacific countries: Australia, South Korea, Taiwan and China, which have now the same emission level than European Union.

The concept of green growth is a condition to overcome increasingly resource constraints, environmental risks and uncertainties that threaten stability and prosperity of the Asian Pacific region


This is shown in the last  ESCAP-ADB-UNEP 2012 report on Green Growth, Resources, and Resilience in Asia and the Pacific prepared for the RIO+20 summit. This study demonstrates that a green growth is the only available path in the future!

The region as a whole is still on track for achieving the first Millennium Development Goal – halving, between 1990 and 2015, the proportion of people below the poverty line – but hard-won gains in reducing poverty and improving people’s lives are now in danger of being reversed in some countries.
 Poor communities in both rural and urban settings are the most vulnerable to the negative impacts of climate change, with those in small island developing states facing perhaps the most immediate challenges. Bangladesh which is one of the poorest countries could be one of the first plagued by rising sea levels due to global warming with climate refugees while its footprint is one of the world’s smallest.

In Asian Pacific region as in other emerging countries economical and environment achievements are inextricably entangled:

  • Food Supply: There are growing concerns about both the adequation and stability of food supply, particularly in light of the continuing food price rises. Food supply is being affected by a number of factors, including low crop yields, rising input costs, competing demands for freshwater, loss of farm land for housing and industry and neglect of investment. Climate-related extreme weather events are compounding these challenges. In addition, the competition for land and changing market forces mean that production of non-food crops is expanding faster than production of food crops, including in South Asia and East Asia, where hunger and undernourishment challenges persist or are growing. Wealthier countries with limited agricultural land have sought to secure access to land for agricultural production in other countries.

  • Water: Seasonal shortfalls in the availability of water are another present and growing crisis in many parts of Asia and the Pacific. While the region has the world’s largest share of renewable freshwater resources, on a per capita basis, it has the lowest availability of water. Complex, evolving, and interrelated water security challenges include competing demands for water, including for agriculture, energy, industry, and domestic use; declining water quality; and vulnerability to climate and ecosystem changes. Seasonal water shortages have become more severe in certain parts of the region as now in the Klang Valley Malaysian area.

  • Energy: As energy demands mount, countries in the region will become increasingly vulnerable to price shocks, especially those that import energy and have high energy intensity (i.e., energy consumed per unit of gross domestic product). Vulnerabilities linked to energy import dependence, aggravated by the volatility of energy prices, will continue to have far-reaching implications for the financial ability of countries to meet their energy demands. A number of countries, especially those in South Asia, face these challenges as they also attempt to greatly increase energy access for their populations. This vulnerability is illustrated by the race for oil resources between China and some ASEAN states and the rising tensions resulting from China ascertaining strategy in the South China Sea. We also see that the problems of energy prices and state subsidies in the region block any important actions of energy conservation or renewable energy development

  • Biocapacity is declining: Ecosystem goods and services provided by natural capital are also in decline due to poor natural resource management decisions, growing human populations and increased per capita consumption. As of 2008, the Asian and Pacific region had the highest number of threatened species; while net gains in forest cover for the region overall hide continuing conversion of primary forested lands, which has accelerated in several countries.

  • Carbon and others Greenhouse gas (GHG) emissions: Although the majority of the historical build-up of atmospheric greenhouse gas (GHG) emissions is the result of emissions from developed countries, Asian developing countries account for the fastest growing source of new emissions. In 2005 Asian Pacific emitted around 11 billion tons of CO2 or 38 per cent of worldwide CO2 emissions. The figure above relative to China shows a steep increase during 2005-2010.

As of 2005, the Asian and Pacific region required three times the input of resources as the rest of the world to produce one unit of GDP

Why such a big domestic material consumption (DMC) input in the GDP? Mostly because the development model of the region is basically export oriented, and also because of the huge investment made in production capacity, infrastructure and housing.
Between 1998 and 2008 (see Figure 4), Asian and Pacific consumption of four main types of materials – biomass, fossil fuels, metal ores/industrial minerals and construction minerals – grew by 45 per cent, from 48.7 billion tons to around 69.4 billion tons. Since 2005, the region has accounted for well over half of global material use, overtaking all other regions combined.
Ominously, DMC input in the Asia Pacific GDP increased from 2000 to 2008, reversing previous trends. The main reason for this reversal is that economic activity in the region is shifting away from relatively more efficient centers, such as Japan, to relatively more resource-intensive centers, such as China. The enormity of this shift has been enough to affect regional and global efficiency trends. If these trends continue, extractive pressures on the environment will increase even faster than the rapid rates of economic growth.


Figure 4


East and North-East Asian countries (China, Korea, Japan, Mongolia..) economically diverse and dynamic but resource constrained are importing increasing quantities of resources per capita to satisfy their growing rate of material consumption. South-East (Brunei, Cambodia, Indonesia, Malaysia, Singapore..) and South and South-West Asian countries (Afghanistan, India, Iran…) , regions with high poverty rates and low per capita access to resources, have physical trade balances that are also increasing – signaling increasing reliance on imports.


Based on modeling conducted if these current trends continue, the Asian Pacific region will consume at least 80 billion tons of materials and 700 exajoules of energy per year and CO2 emissions are likely to more than triple by 2050.

Sustainable growth can only happen through a second industrial revolution characterized by systems innovation, high resource use efficiency, and a greatly reduced reliance on hydrocarbons


Such strategies can help build a “green economy,” characterized by substantially increased investments in economic activities that build on and enhance the earth’s natural capital, while reducing ecological scarcities and environmental risks – activities such as renewable energy, low carbon transport, energy- and water-efficient buildings, sustainable agriculture and forest management and sustainable fisheries.

Addressing the “time gap” between short-term costs and long term benefits of green investments will require collaborative action between governments and the private sector to overcome the present financial barriers and risks that restrict capital flows into green sectors, thereby leading to increased investment.

To help provide this momentum, eco-tax reform offers a key cross-cutting, integrative policy tool that can help to secure a “double-dividend” for both the economy and the environment by emphasizing a shift from taxing the “goods” (for example labour) to taxing the “bads” (resource use and pollution).

Two examples of changing price signal are particularly important in Asia Pacific region for addressing the necessary Green growth implementation:

  • Subsidy reform on fuel prices and poverty reduction in Indonesia: the removal of subsidy on the costs of energy in emerging countries is a prerequisite for the development of renewable energy. While subsidies are politically attractive, they can discourage conservation and efficiency improvements and do not always benefit lower income group. In Indonesia an estimated 40 per cent of the high income households benefitted from 70 per cent of the fuel subsidies, while 40% of the poorest only benefitted from 15 per cent. Energy subsidy reductions were coupled with cash transfers to low-income households to mitigate the impacts of the resulting higher energy prices. The need for subsidy reform is becoming widely acknowledged, with the G-20 agreeing in September 2009 to gradually phase out fossil fuel subsidies.


  • Water prices set at a level to recover the full costs of producing and supplying fresh water, as well as to reflect the higher incremental cost of additional supplies as has been done in Singapore. Having water tariffs that reflect the true cost of water production, supply and treatment free up other funds for research and development to identify innovative and more efficient ways of treating and distributing water, and to construct new water supply sources to meet future demand. Other enabling conditions are high level of government effectiveness, strong political will and effective legal and regulatory framework


Thursday, July 5, 2012

RIO+20 The climate clock is speeding up: but most countries are striving to save time and not the Planet!


Since the 1992 Rio Earth summit much time and enthusiasm have been lost


The 1992 Rio Earth Summit was an important achievement and hope for the future of Humanity with an agreement on the Climate Change Convention which led to the Kyoto Protocol. The Convention on Biological Diversity was also opened for signature at the Earth Summit. 

The Kyoto Protocol signed in 1997 entered into force on 16 February 2005. As of September 2011, 191 states have ratified the protocol while 36 developed countries collectively agreed to reduce their greenhouse gas emissions by 5.2% on average for the period 2008-2012. The United States are the only participant which have not ratified and would be afterwards the driving force behind denying the global warming certainty.


The 2009 Copenhagen summit concluded a "weak political statement" after an alliance of big polluters such as United States with big emerging countries (Brazil, South Africa, India and China) object of much US diplomatic attention and financial aid promise. The agreement concluded in the 2010 Cancún climate talks includes a "Green Climate Fund," proposed to be worth $100 billion a year by 2020 but no agreement on how the Fund will be raised.


In the 2011 Durban Conference negotiators agreed to be part of a legally binding treaty to address global warming and continue the Kyoto Protocol after 2012. Nevertheless the terms of the future treaty are to be defined by 2015 only and become effective in 2020. This agreement, referred to as the "Durban platform", is notable in that for the first time it includes developing countries such as China and India, as well as the US.


Since 1992 climate evolutions are worsening and unbalances more difficult to handle


Carbon emissions due to human activity have risen by almost 50 per cent and CO2 levels in the atmosphere have risen by more than ten per cent. The levels of other greenhouse gases in the atmosphere have also increased significantly.


Global temperatures have continued to fluctuate with an increased variability and mean temperatures have continued to rise at about 0.1°C per decade.


Global mean sea level has risen about six centimeters since 1992 and is currently rising at a rate of about three centimeters per decade. The melting of Greenland and West Antarctic ice is now contributing at least one third of this rise. Arctic sea ice cover has also been decreasing at all times of year. The minimum area of the ice cover in September has decreased by about 20 per cent since 1992.


In the same period there have been many extreme temperature variation: the Russian heat wave of 2010 had temperatures 10°C higher than normal, in the following winter Europe experienced extremely cold temperatures mean temperatures 5°C below average. Rainfall patterns have also been unusual with major flooding events, such as in 2010in northwest Pakistan, and droughts such as the recent one in east Africa. Whether the occurrence of such events is greater than would be expected in the absence of human interference with the climate system is not clear. However, climate models suggest that this has led to an increased likelihood for many of them…


The declaration adopted at the Conference “The future we want” is a blurred road map and a weak agreement


The conference recognize that sharing of efforts on climate stabilization should be discussed as part of three social, economy and climate fundamental pillars and as a consequence decided to integrate all these cross issues and to merge them into the Millennium Development Goals Agenda 21 objectives. The following are notably concerned: poverty eradication, food security, nutrition and sustainable agriculture, oceans and seas, forests, biodiversity, desertification, land degradation and drought, chemicals and waste, sustainable consumption and production, education and gender equality and the empowerment of women. It is dubious whether this will really help to improve and accelerate climate discussion!


The hopes concerning a more decisive action on “Green economy” have been poorly satisfied. While 19 paragraphs were devoted to the green economy a definition of what is supposed to be the green economy is not provided!  Rather than saying what should be done there is a long list of evident precautions to be taken: each country can choose an approach in accordance with its national sustainable development plans; Green Economy should provide options and not be a rigid set of rules; it cannot be a means of arbitrary discrimination or a disguised restriction on international trade…Or there is an unnecessary reminder of various provisions already agreed upon: Green Technologies transfer to developing countries should be addressed under the provisions on technology transfer, finance, access to information, and intellectual property rights as agreed in the 2002 Johannesburg Plan…


No real progresses were made at the institutional level to give greater visibility and more efficiency- no World Environment Organization- to the Institutional framework for sustainable development outside the usual jargon for creating various groups or forums.


Concerning the Sustainable development goals there is no quantified commitments. These Sustainable development goals have been quietly recycled as part of the Millennium Development Goals based on Agenda 21 on poverty eradication in 2015. An open working group shall be constituted no later than September 2012 with representatives from the five United Nations regional groups, with the aim of achieving fair, equitable and balanced geographic targets and indicators…


Certainly things could have been much worse… Europe has really been united but had ended up on World Environment Organization or the protection of the oceans with a veto of Brazilians, Americans, Canadians and Chinese that grew to a minimum text.


Civil society is ready for the ecological and social transition, but are political will and courage missing to drive this long-awaited change?


Most reactions after the summit were very disillusioned. However, we can try to highlight some more positive views expressed by some stakeholders


There is an evidence need to get beyond the GDP, towards a far richer conception of what constitute economic development (see the first “Inclusive Wealth Report IWR” from UNEP). Most indicators are averaged or aggregated and we need to determine how inclusive wealth, income and outcome are distributed.

 Many of goods and services that are essential to humanity are provided free. Natural, human and social assets and their associated services should be accounted for as part of the economic development growth.


The consequences of using incorrect economic values for natural resources can be considerable. The under-pricing of water, for example, is leading perhaps to the largest single global economic subsidy in the world today.


And we may be entering a new era of uneconomic oil, where the costs of extraction are far greater than its benefits, once we fully cost the associated environmental and social impacts.


Chinese pollutes twice as European and is now the leading global polluter. Indoor and outdoor air pollution in China was estimated to have increased morbidity rates and reduced real GDP growth by more than three per cent.


Rio+20 outcomes are an intersection of sustainability and development ambitions challenges. In this respect there is an interesting input from the Club of Rome (http://www.green-alliance.org.uk/concerning the planetary natural and social boundaries, their connection with the Sustainable development goals and their necessary integration with the Millenium Development goal. The planetary boundaries are defined as ceiling and foundation (see figure 1):

  • “An Environment ceiling”: Nine planetary boundaries can been described in natural metrics: (A) Climate change, (B) Fresh water use, (C) Nitrogen and Phosphorous Cycles, (D) Ocean Acidification, (E) Chemical Pollution, (F) Atmospheric Aerosol Loading, (G) Ozone Depletion, (H) Biodiversity, (I) Land Use. 


Figure 1: The Planet  Natural and  Social boundaries


  • “A Social foundation”: Eleven Critical Social Deprivations: (1) food, (2) Water, (3) Income, (4) Education, (5) Resilience to shocks, (6) Voice/ democracy, (7) Jobs, (8) Energy, (9) Social Equity, (10) Gender Equality, (11) Health Care. 


Humanity has already exceeded several critical planetary boundaries and scientists estimate that 3 planetary boundaries have been crossed: (A) Climate Change, (C) Nitrogen Phosphorous Cycle and (H) Biodiversity.

Millions of people still live far below the social foundation. Around 13% of people are undernourished, with a gap below the social boundary for (1) food, 21% live on less than the threshold of poverty of $1.25 per day with a gap for (3) and 19% have no access to electricity with a gap for (8).

But the really striking implication here is that ending poverty and exclusion need not be a source of stress on planetary boundaries to fill the gap below social boundary. Only 1% of CO2 are necessary for (8) Energy, 1% of current food supply for (1), 0.2% of global income for (3).


Figure 2:  Cumulative 2008 Footprint & Biocapacity classified by decreasing unit country footprint


What is the biggest source of planetary boundary stress today? We can look at unit footprint per capita country repartition in the last WWF Living Planet report  (http://wwf.panda.org) . 

The excessive unit footprint levels from 20% global population (figure 2) mostly- but not always- the wealthiest generate around 45% of the Planet footprint and 55% of its Carbon footprint. A mere 17% of the global population produces around 50% of  the Carbon footprint. 

So the richest countries must quickly shift their business model towards  a greener economy  as most developed countries- apart from North America-  began to do since the Kyoto Protocol .

Adding to the excessive resource use of the well-off are the aspirations of a growing number of consumers seeking to emulate today’s high income lifestyles. Over the next 20 years, global population will grow by 1.3 billion people, while the global middle class is expected to grow from under two billion consumers today to nearly five billion by 2030. It means that it will be necessary for the developing countries middle class also to emulate the greener economy model shift.

It is clear that, if humanity is to live between its social and planetary boundaries, there will have to be far greater equity in resource use, both within and between countries. But there will also have to be far greater efficiency in how resources are transformed and handle to meet human needs.


Thursday, June 14, 2012

Asian Pacific Biocapacity Growing Unbalance

Angsana leaves and flowers 


The Asian Pacific unit footprints in 2008 are presented in the last WWF Living Planet Report. They are closely related to the country achieved development. The absolute footprint levels- after factoring by the population- are necessary to assess the growing unbalance within the Asian Pacific territory.

Asian Pacific Population distribution

Asia Pacific area covers three distinctive ecozones: Indomalaya, Australasia and Oceania with extremely inhomogeneous population distribution (see figure 1):

o    3 hugely populated countries (200- 1400 mil): China, India & Indonesia with are around 74% of Asian Pacific population;
o    6 big countries (50-190 mil): Pakistan, Bangladesh, Japan, Philippines, Thailand, Vietnam altogether about 17% ;
o    14 intermediate countries (1-45 mil): all around 9% on which South Korea, Myamar, Nepal, ,Malaysia - where I live -,  Australia, North Korea, Sri Lanka, Cambodia, Lao, Papua, Singapore, New Zealand, Mongolia, Timor Leste;
o    Then we have around 15 very small countries (< 1 mil): mostly tiny islands which are presented as one group:  Brunei, Maldives, Fiji, Polynesia, New Caledonia, Micronesia, Tonga, Vanuatu etc..


Figure 1
 The unit footprints in Asia Pacific in 2008

The unit footprints (see Figure 2) are measured in gha per person. They are closely related to the country achieved development. Australia & Singapore's are the highest and very similar to US or Canada footprints. Mongolia footprint is also very high and this maybe is due to the huge amount of coal burning. South Korea, Japan, New Zealand even Malaysia are intermediary high and similar to EU. After, there are a group of 3 countries - around 2 gha per person- with Thailand, China and New Guinea. The remaining 13 countries are in the range of 1 gha per person including Indonesia (1.14), Philippines (0.99), India (0.87) and Pakistan (0.75).

On the other hand the highest unit biocapacity are located in Mongolia, Australia, New Zealand which are huge countries but with small populations that could be considered as “sources” of biocapacity for the other ones.

Is this a fair presentation concerning Singapore which is mostly an urban area with a very limited biocapacity? We know that the City-State has greatly improved its environment notably limiting car traffic, developing mass transport, building water protecting and cleaning capacities. A comparison with other city including Honk Kong or Kuala Lumpur should certainly be more relevant.


Figure 2


Absolute footprint and Asian Pacific biocapacity unbalance in 2008:

The absolute footprint levels (as opposed to the unit levels) are more pertinent to assess the unbalance with the various territory biocapacities which are mostly an attribute of their size and climate conditions.

We can derive the country absolute footprint by factoring the above unit footprints by the population (see figure 3). The situation is completely different and mostly impacted by 7 countries: Chinese, India, Japan, South Korea, Indonesia, Thailand and Australia which together amount to 5254 mil gha representing more than 85% of the overall Asian Pacific footprint.


Figure 3
 As we can see in Figure 3 there is an unbalance of 90% for the Asian Pacific area while for the planet we have only 30% unbalance. What does it means? When on average we need one and a half year for the planet to produce again all its yearly needed bio resources, the same figures for the Asian Pacific are two years needed for one year demand.

It looks like the Asian Pacific area is the biggest “sink” of biocapacity in the Planet with an unbalance around 2 883 mil gha which is more than twice the EU sink value (1 228 mil gha) or 4 times de North American sink value (730 mil gha).

Furthermore, we know that the "global" ecological footprint as proposed by the WWF is not very representative for Asia-Pacific region which development is based on an export-oriented model aiming the richest countries. The latest phase of globalization destroyed many industrial jobs in high-income countries and the greater part of them were relocated to Asia Pacific.

So the “real” footprint including biocapacity inputs in all the GDP and not only in household consumption should worsen the unbalance.

The WWF Living Planet Index in Asian Pacific

The WWF Living Planet Index is a composite indicator that measures changes in the size of wildlife populations to indicate trends in the overall state of global biodiversity. These measures of biodiversity of each ecosystem echo and clearly confirm the dramatic reduction in biocapacity in the Asian Pacific Ecozone in recent years.

Even if the Indopacific zone is one of the richest for living animals and species, its Living Planet Index as established by WWF declined by 64% during the last 40 years. While in the same period the WWF LPI for the overall Planet decreased by only 28%. Asia Pacific has the biggest reduction for all terrestrial, marine or fresh water populations or species monitored by WWF.    

These declines reflect large scale forest and other habitat loss across these realms, driven by logging, growing human populations, and agricultural, industrial and urban development. Tropical forest cover declined most rapidly in Southeast Asia between 1990 and 2005, with an estimated 0.6-0.8 per cent loss per year.


Asia Pacific Footprint in 2008 and Evolution since 2005

What is 2008 Asian Footprint made of?

We see (Figure 4) that the two biggest components in the Footprint are the CO2 and the Cropland expressed in hectare of ground land and forest needed for growing crop or absorbing the released Carbon. The Carbon is also time-wise the more dynamic component: on the last 10 years there was an absolute two fold increase.
Figure 4


The unbalance with biocapacity is mostly produced by Carbon release. The CO2 exceeding the natural absorption of forest and water biocapacity is stored in the atmosphere and leads to a deterioration of climatic conditions: GHE temperature rise, instability, extreme events etc..


Footprint Evolution 2005-2008:

The Asian Footprint evolution 2005-2008 is recorded by WWF in its two reports: WWF Living Planet 2010 and WWF LPR 2012.

Asian Pacific footprint on this 3 years period (Figure 5) increased by 5,7% which is more than twice the Planet footprint increase during the same period. Asia Pacific needs more Fishing ground (almost doubling), Forest land produce or service, Built up land and Carbon regeneration; it needs less Crop land and Grazing land. The diet modifications resulting from higher income conditions maybe explain this profile with more fish and less cereal.


Figure 5


In the Asian Pacific zone the biggest increases by countries (Figure 7) are in China, Indonesia, India, Malaysia, South Korea, Myanmar, Thailand. Japan is the biggest decrease (-16%) and some developed countries are slightly reducing: North Korea, Australia, New Zealand. 

Figure 6


Conclusion: Asian Pacific ecological growing unbalance in 2008

When we factor the unit footprint or biocapacity by the population we have the footprint and biocapacity for the overall territory. By comparing both values we derive each country unbalances as a percentage of its biocapacity or as an absolute value (Figure 7).

Biocapacity sources are mostly in Australia, Indonesia, Mongolia, New Zealand, Myanmar, Papua New Guinea and Lao PDR. Altogether we have only 288 mil gha sourced internally which is less than 10% of its total biocapacity.

Biocapacity sinks are mostly in China, India, Japan, South Korea, Thailand, Pakistan, Malaysia, Bangladesh, Philippines, Singapore, Vietnam, North Korea, Sri Lanka. Altogether we have 3170 mil gha less the 288 mil gha sourced in the same zone which adds up to 2883 mil gha the global unbalance or 90% of biocapacity that needs to be sourced outside the zone.

This growing imbalance in the needs of biocapacity will become increasingly a factor limiting the growth of the Asian Pacific zone and a source of tension within and outside the area itself.

Moreover we must remember that the ecological "global" footprint as proposed by WWF is not very representative for the Asian Pacific zone which development is based on a model of export to richer countries. Thus, the "real" footprint, including addition of inputs of biocapacity in all various GDP components- not only household consumption- are expected to further exacerbate this imbalance.


Figure 7